Market Data Bank

Click image to enlarge
On June 13, 2022, the S&P 500 dropped more than 20% from its January 3, 2022, all-time high.
Inflation, Russia, and the pandemic could send stocks tumbling further, and it’s a time of high financial anxiety.
This presentation provides performance data framed from the perspective of a financial professional.
Click image to enlarge
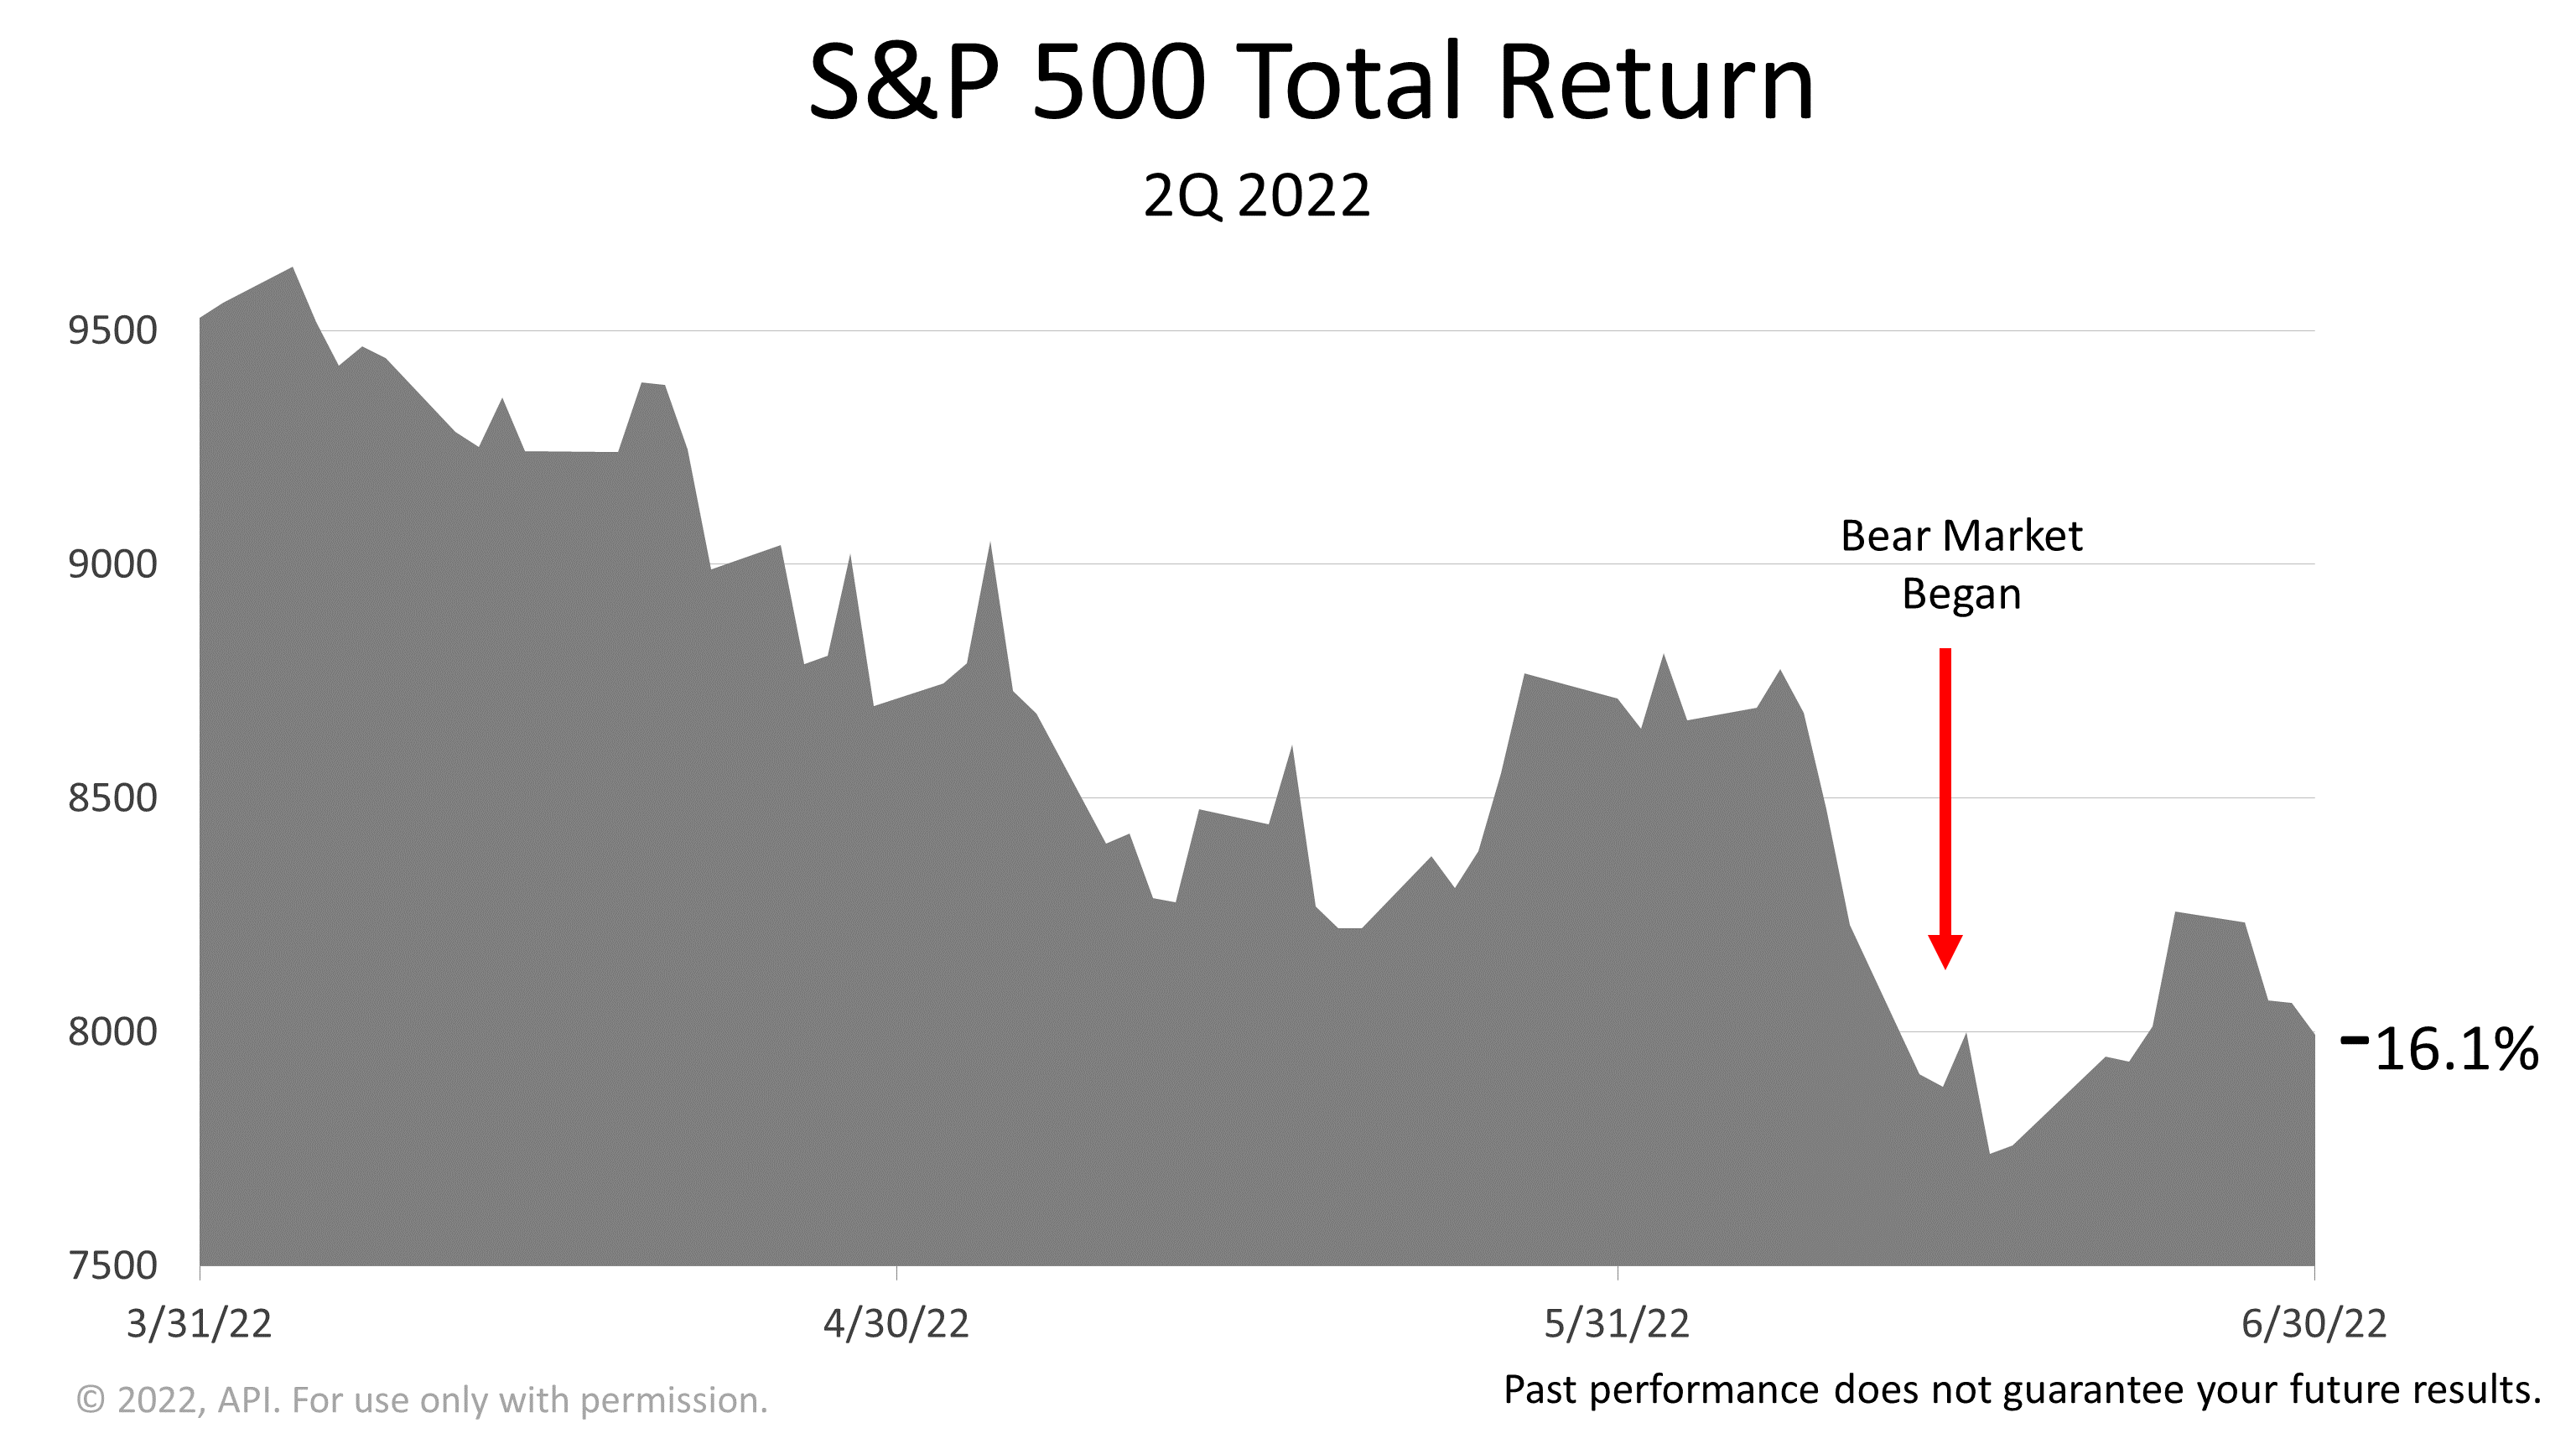
2022 had already been a bad year for investors before the bear market officially began in mid-June.
Stocks posted a -16.1% loss in the second quarter of 2022, following a -4.6% loss in the first quarter of 2022.
Inflation for months has been running at its highest rate in four decades, and the European Union’s ban on Russian oil could send energy prices higher as the end of 2022 approaches.
Meanwhile, COVID-related supply chain problems still hinder consumer spending, which drives 70% of the U.S. economy.
Click image to enlarge
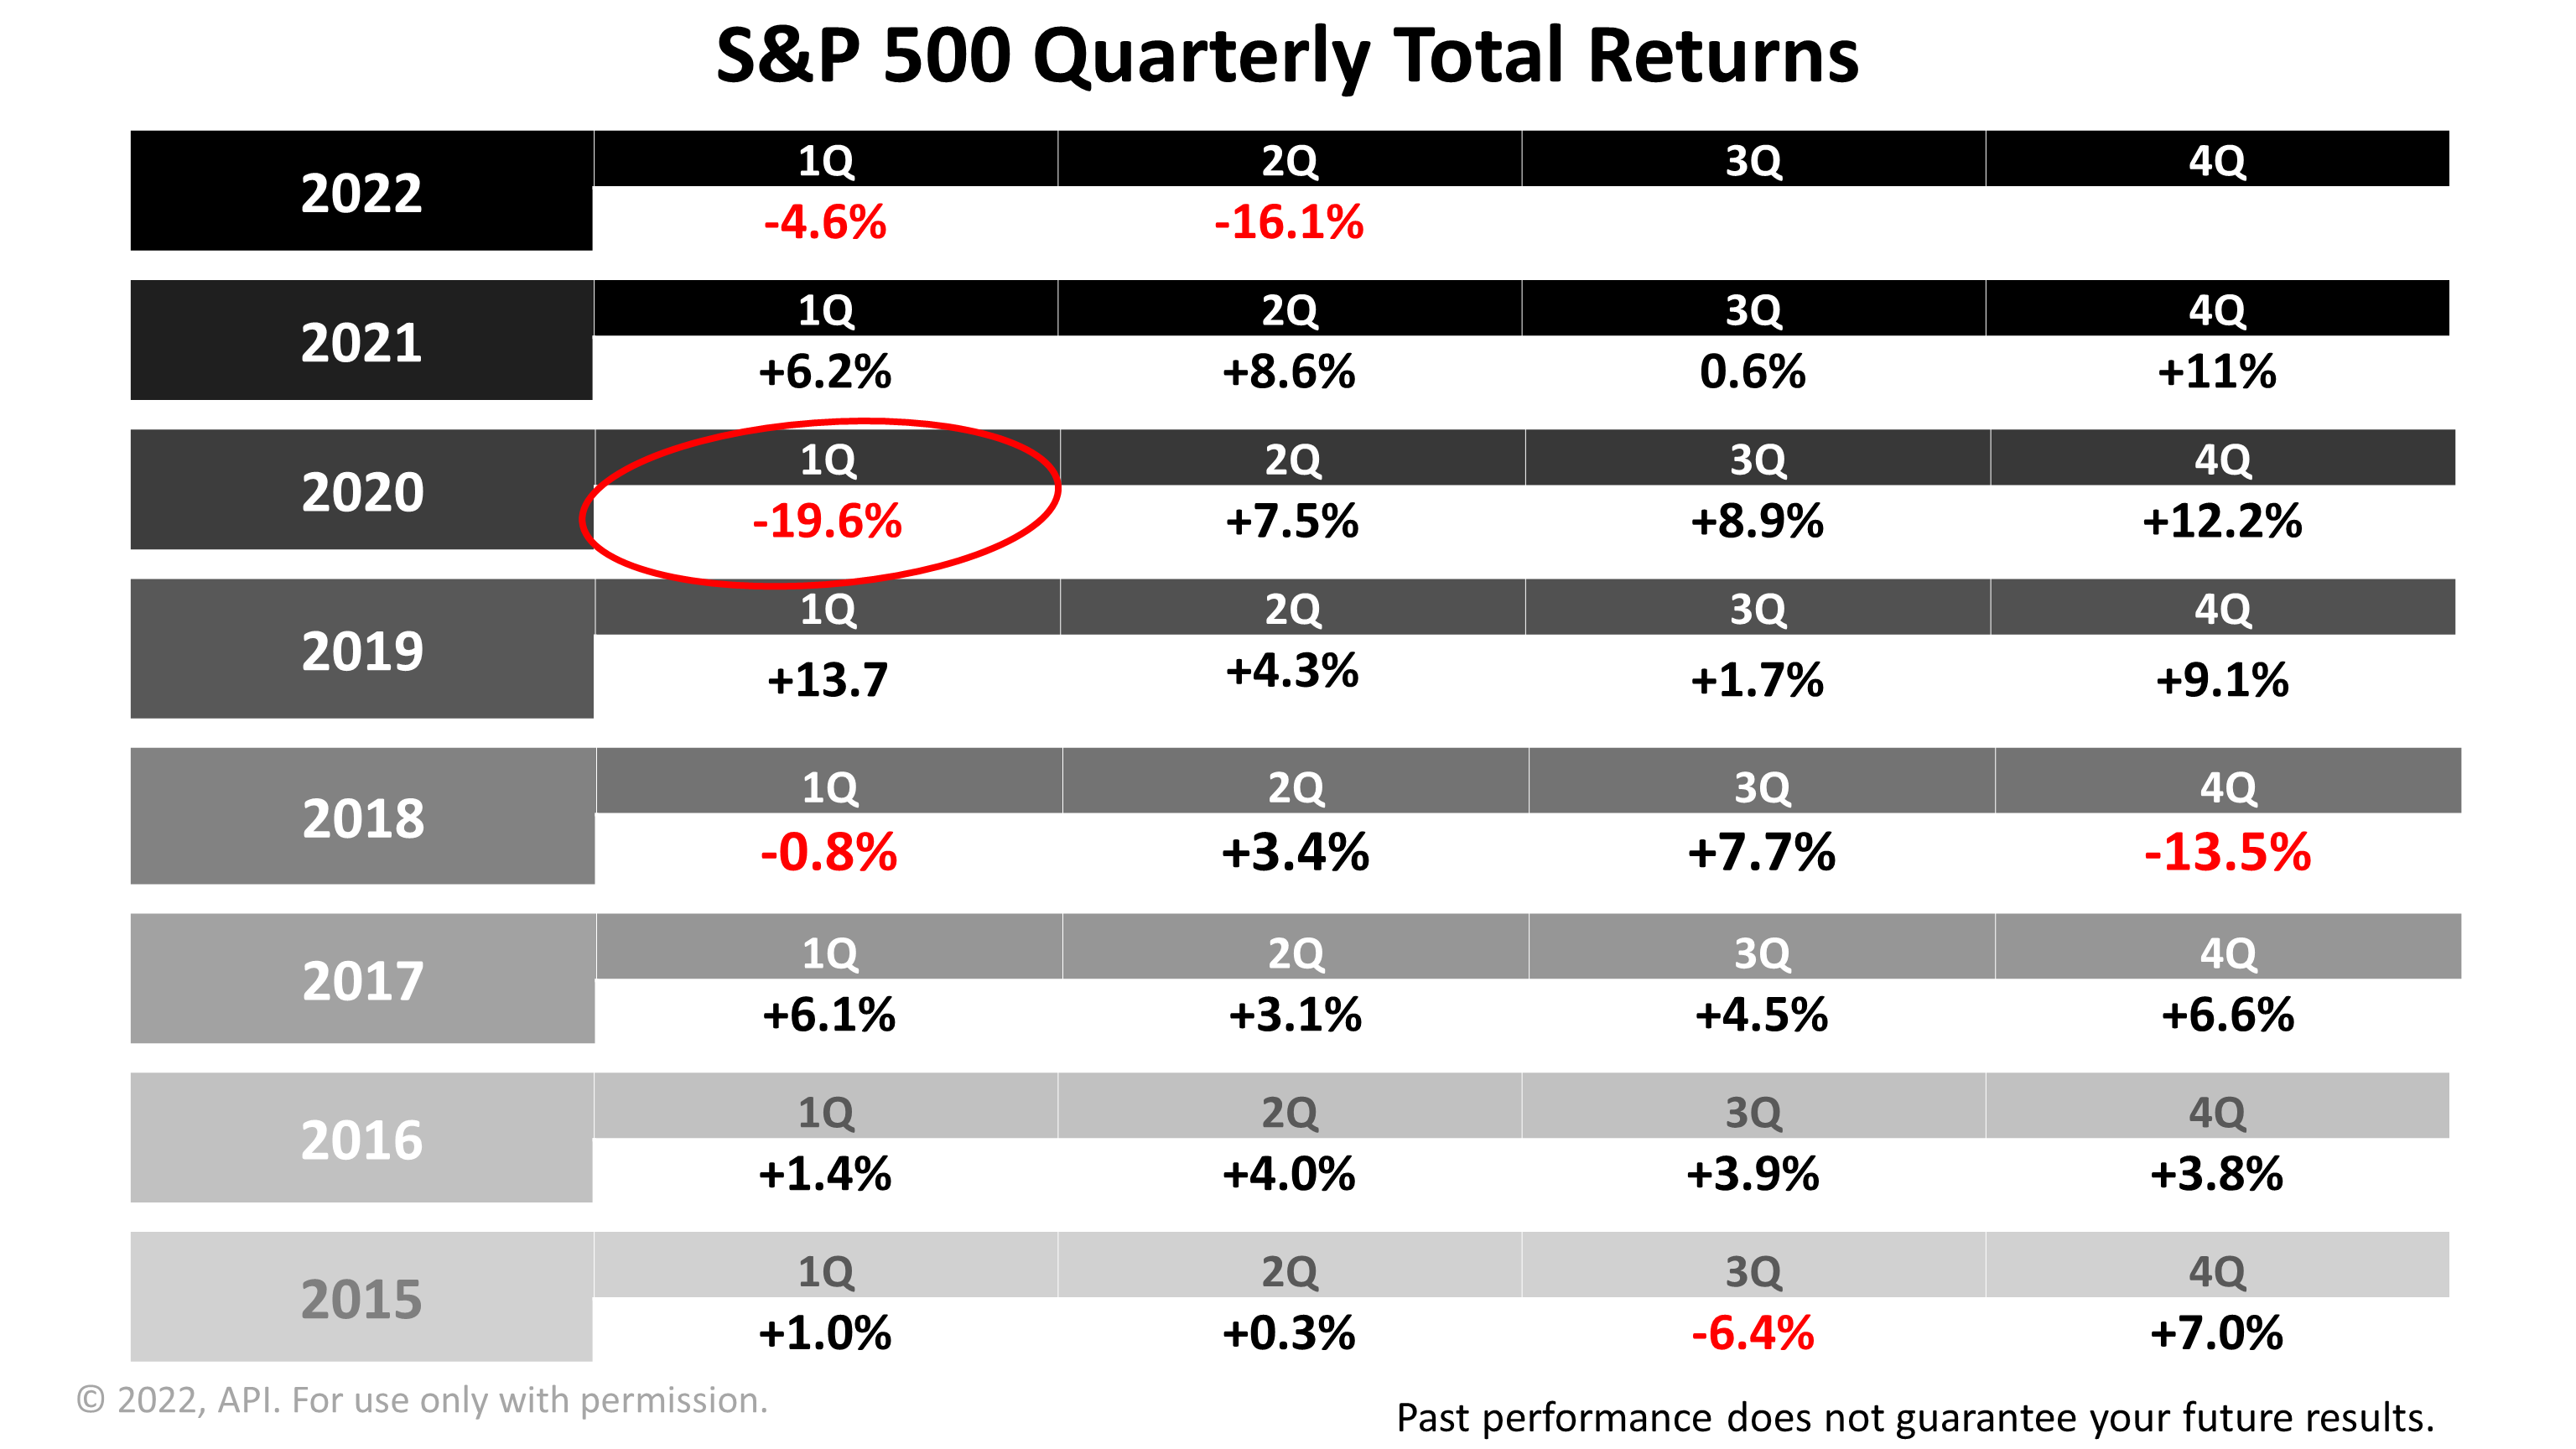
The extraordinary events we’ve all been living through since the start of 2020 have whipsawed investors.
In the first quarter of 2020, the S&P 500 plunged.
The -19.6% loss in stocks that quarter was actually much worse than it appears in this table.
Click image to enlarge
Looking back at the price chart, at the tail end of the first quarter of 2020, stocks had declined by as much as -34% on March 19, 2020, before rebounding to end the quarter with a loss of “only” -19.6%.
That big bear market loss set the stage for a spectacular seven-quarter bull market run that peaked January 3, 2022.
Click image to enlarge
Stock prices soared every quarter from the second quarter of 2020 to the end of 2021.
This was followed by a -4.1% loss in the first quarter of 2022 and loss of -16.1% in 2Q 2022.
Click image to enlarge
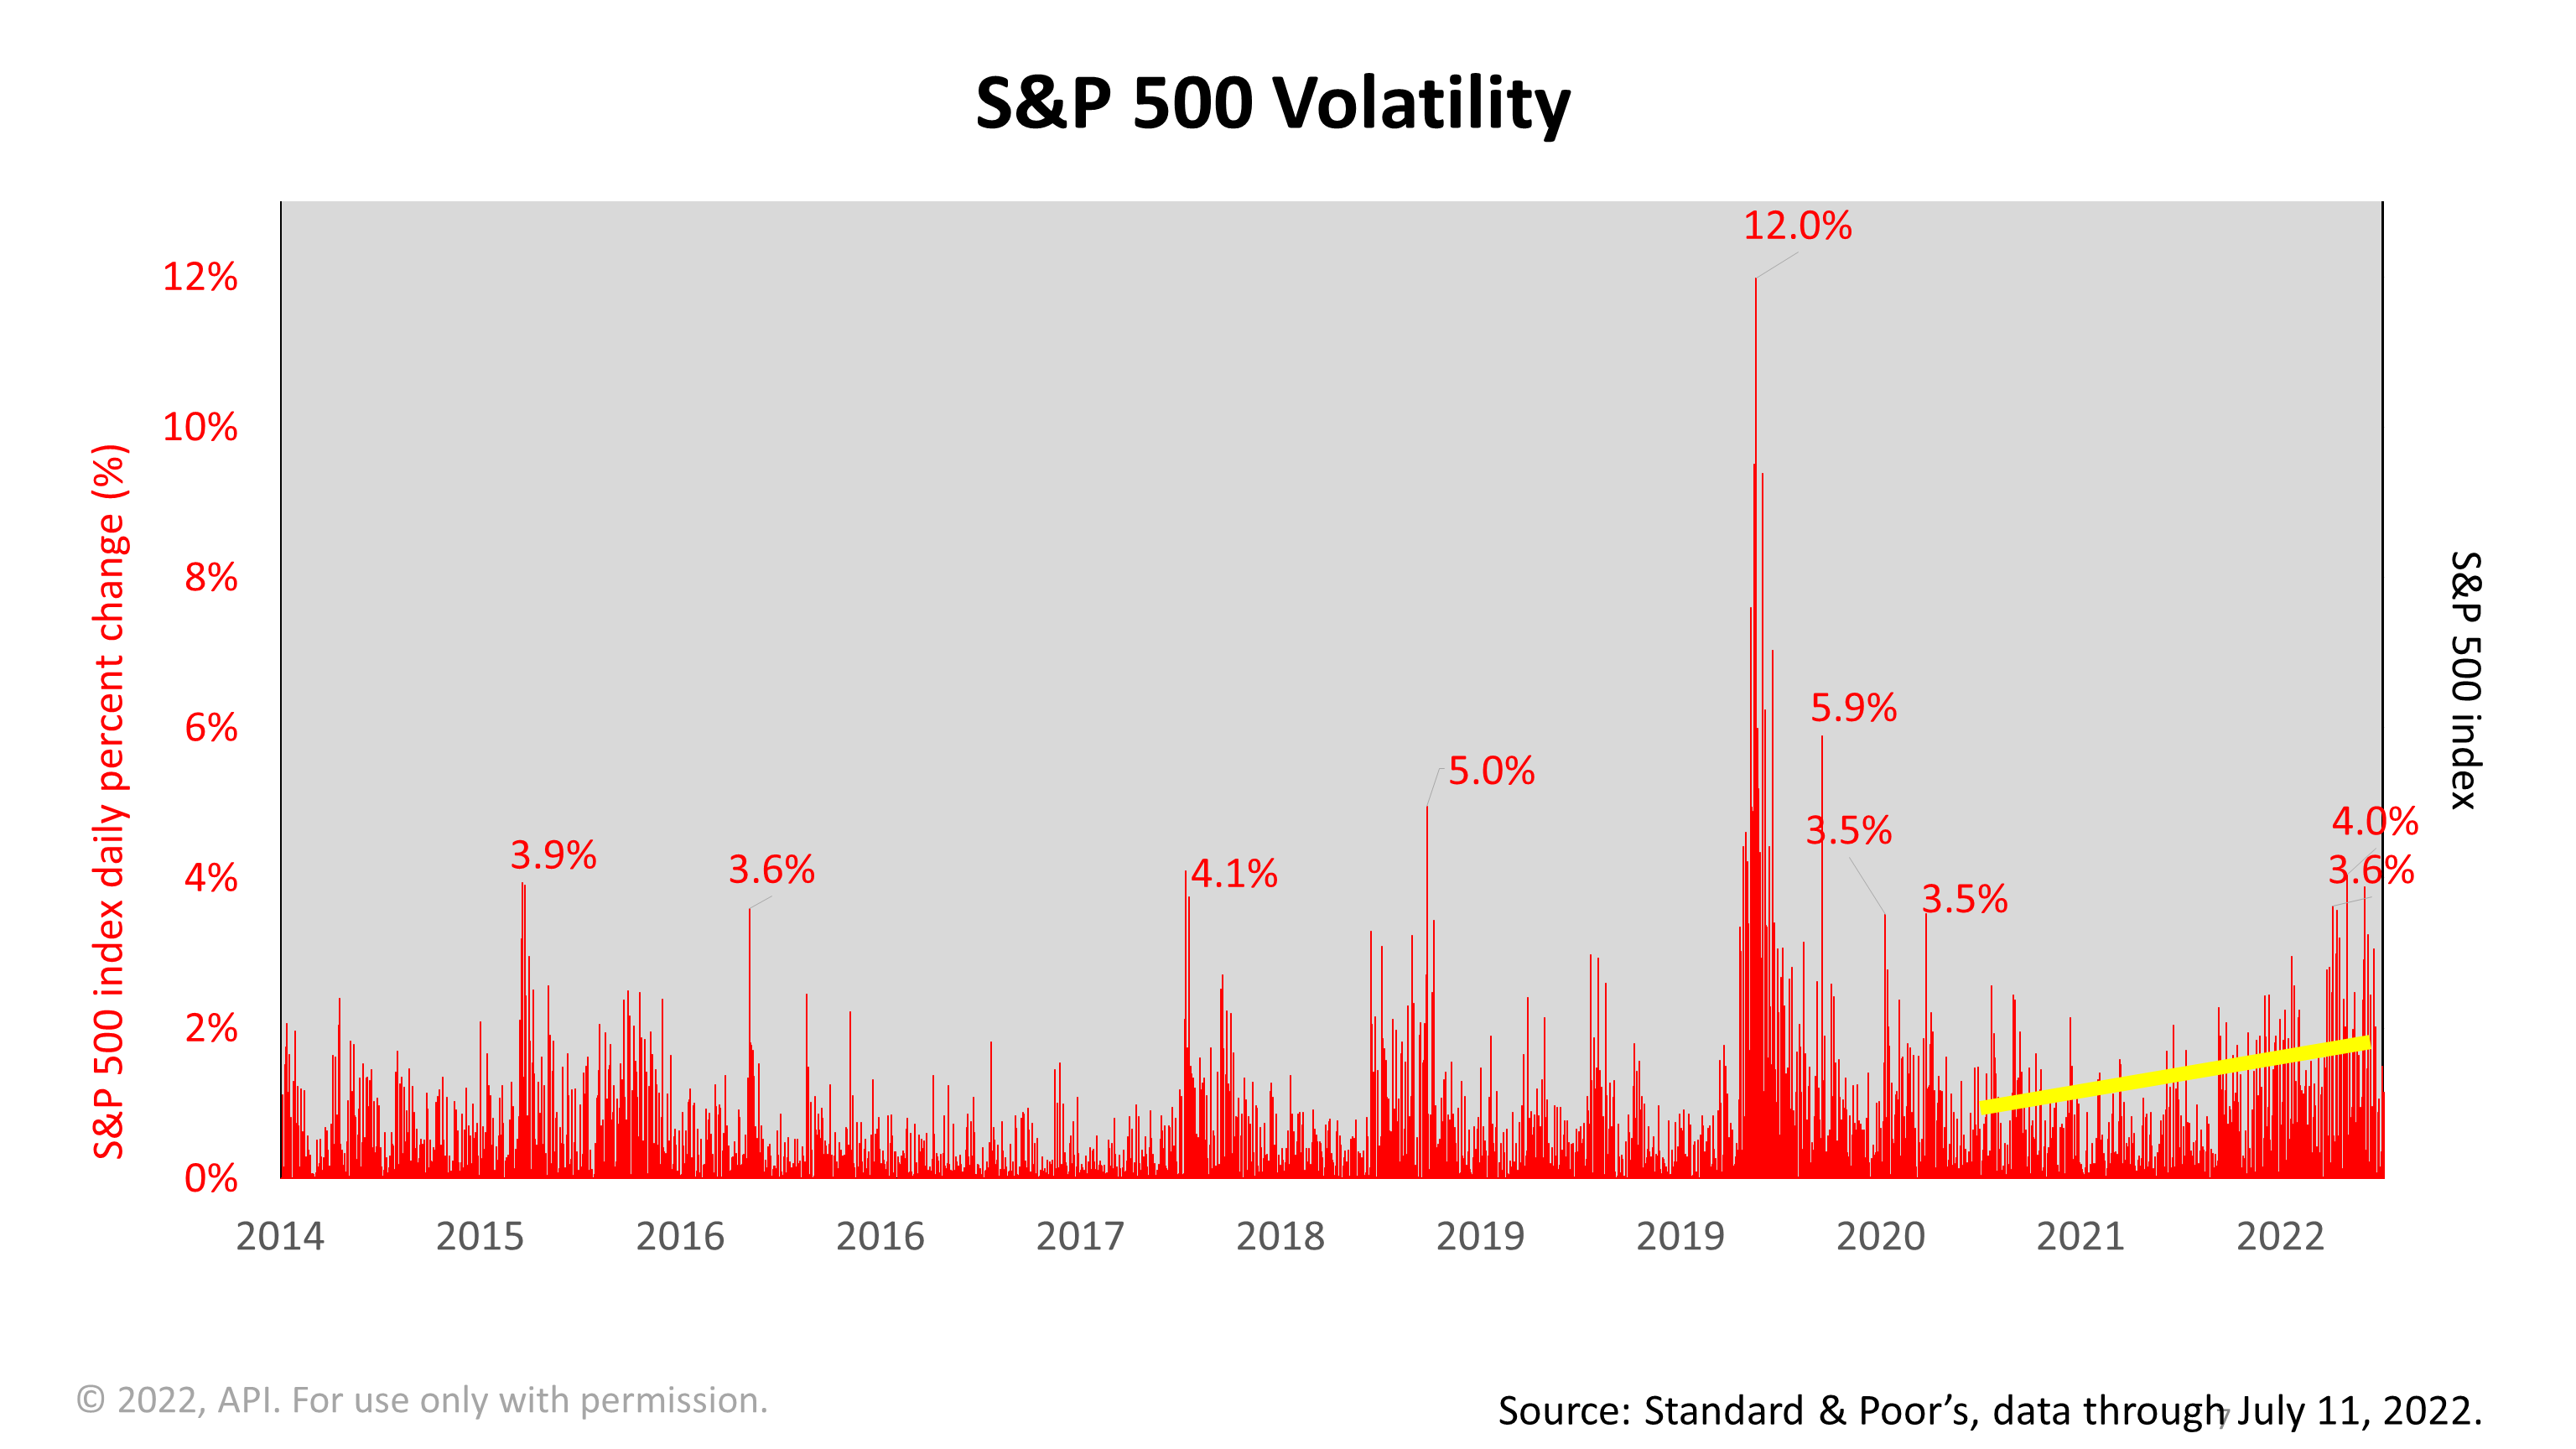
Volatility in the stock market has increased.
The red area shows one-day volatility spikes in the S&P 500.
The yellow line highlights the trend toward greater volatility since 2020.
Stocks pay a premium for their risk, according to modern portfolio theory.
Recently, we actually hit some down days of -3.6% and -4% in the stock market. That shakes people up.
But remember why you bought stocks.
The basic axiom of investing in the stock market is that you deliberately look for an asset class that is volatile.
After all, if you don't own an asset class that's going to be volatile, why are you entitled to +10% long-term total return in the stock market?
You're not.
In order to earn that long-term equity risk premium, you've got to own something that's going to be volatile day-to-day.
So, don't be surprised when you run into some volatility.
As you can see in the chart, the norm is volatility.
And that's exactly why stocks long-term have a return of about +10% a year.
It’s because you have traded that premium return by accepting the volatility of stocks.
Click image to enlarge
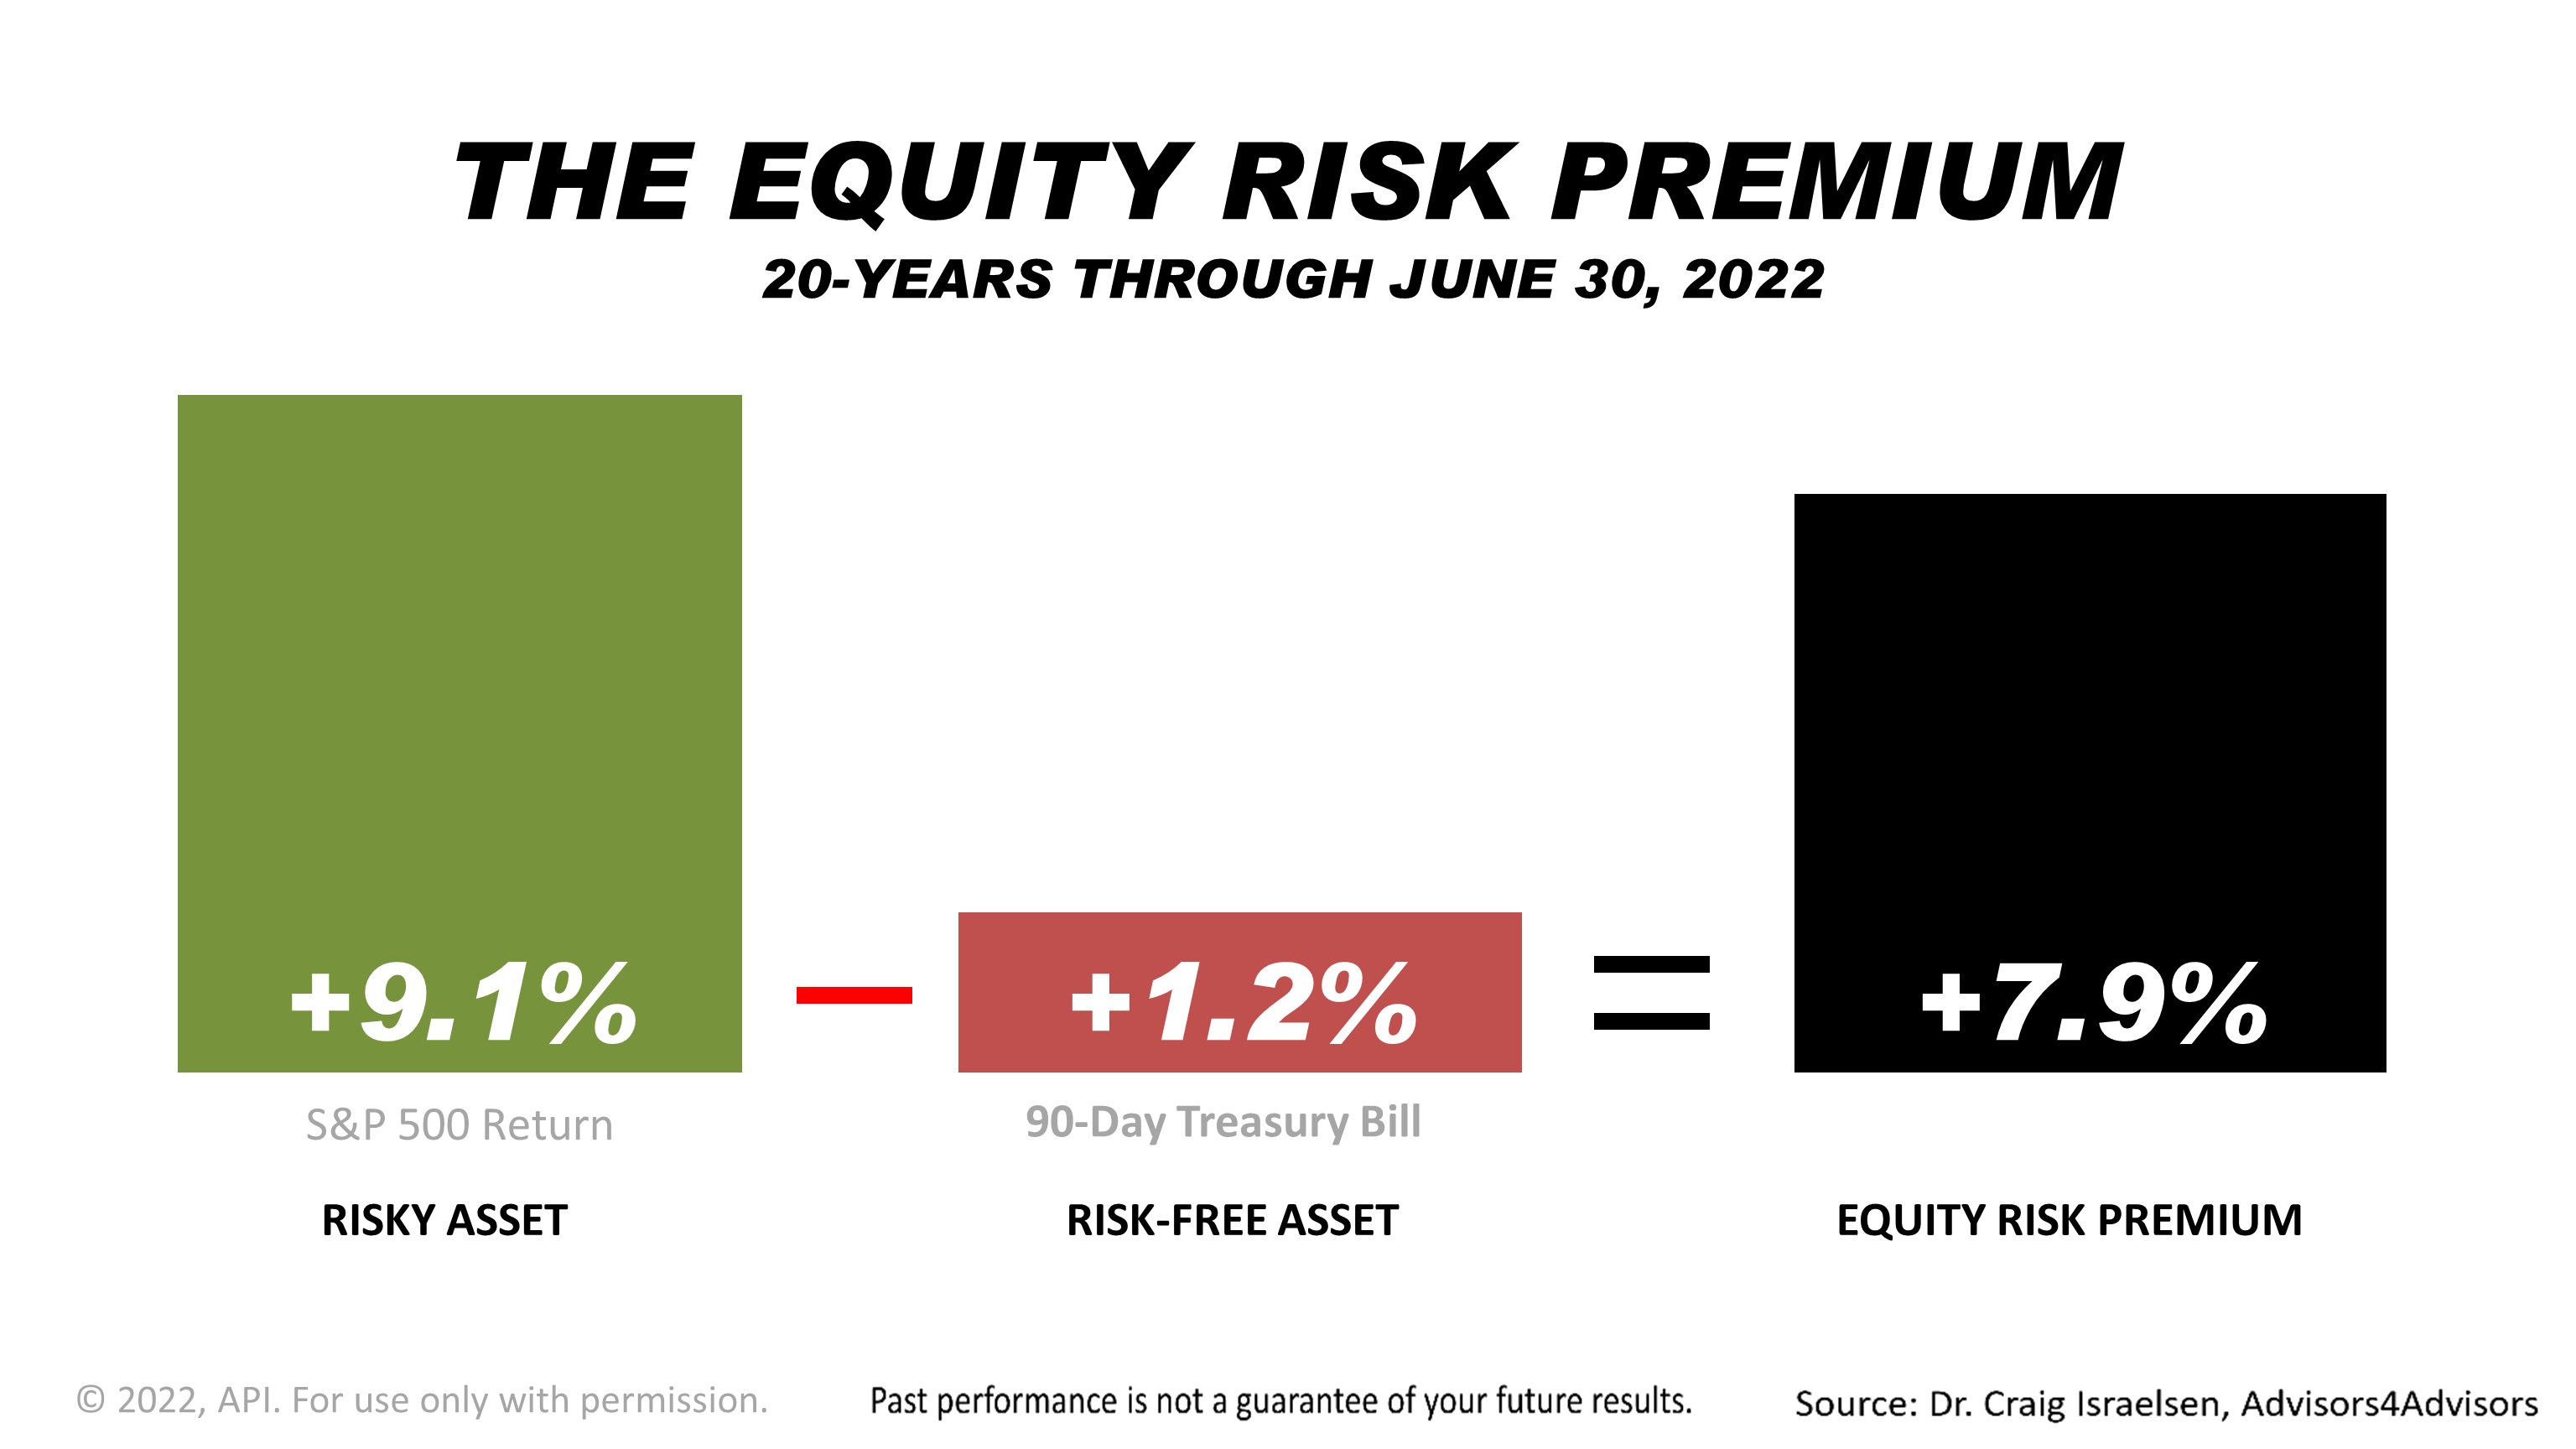
The equity risk premium, a concept in modern financial theory illustrated here, quantifies the premium stocks annually averaged in the 20 years ended June 30, 2022.
Stocks, as measured by the Standard & Poor’s 500, averaged a +9.1% annual return in the 20 years—nearly seven times the +1.2% annual return on the risk-free 90-day U.S Treasury bill.
Backed by the full faith and credit of the U.S. government, T-bills are considered a riskless investment.
In contrast, the value of the S&P 500 index is subject to ups and downs, and, in theory, if all 500 blue-chip companies in the S&P 500 index go bust, your entire investment could be lost.
Subtracting the return on T-bills from the return on stocks, the resulting +7.9% is the premium paid for taking the risk of owning U.S. stocks over the 20 years.
To be clear, investing in America’s 500 largest publicly held companies earned an average of +7.9% more annually than a risk-free investment in the past 20 years.
This 20-year period encompassed four frightening bear markets—the tech crash of 2002, the financial crisis of 2008, the COVID downturn of early 2020, and the current bear market.
Past performance is no guarantee of your future results, and that, paradoxically, is precisely why investors are paid a premium for owning stocks.
Yes, stocks are risky and past performance is no guarantee of your future results!
Be glad for it!
It is precisely why stocks have returned +7.9% more annually than U.S.-government-guaranteed investments through four bear markets and financial crises of the past 20 years.
Click image to enlarge
No one can guarantee that the equity risk premium will remain as large in the future, but this next chart shows why the U.S. stock market is likely to remain the world’s favorite equity investment for decades.
The chart illustrates another key concept in modern finance, the growth potential of an economy.
Click image to enlarge
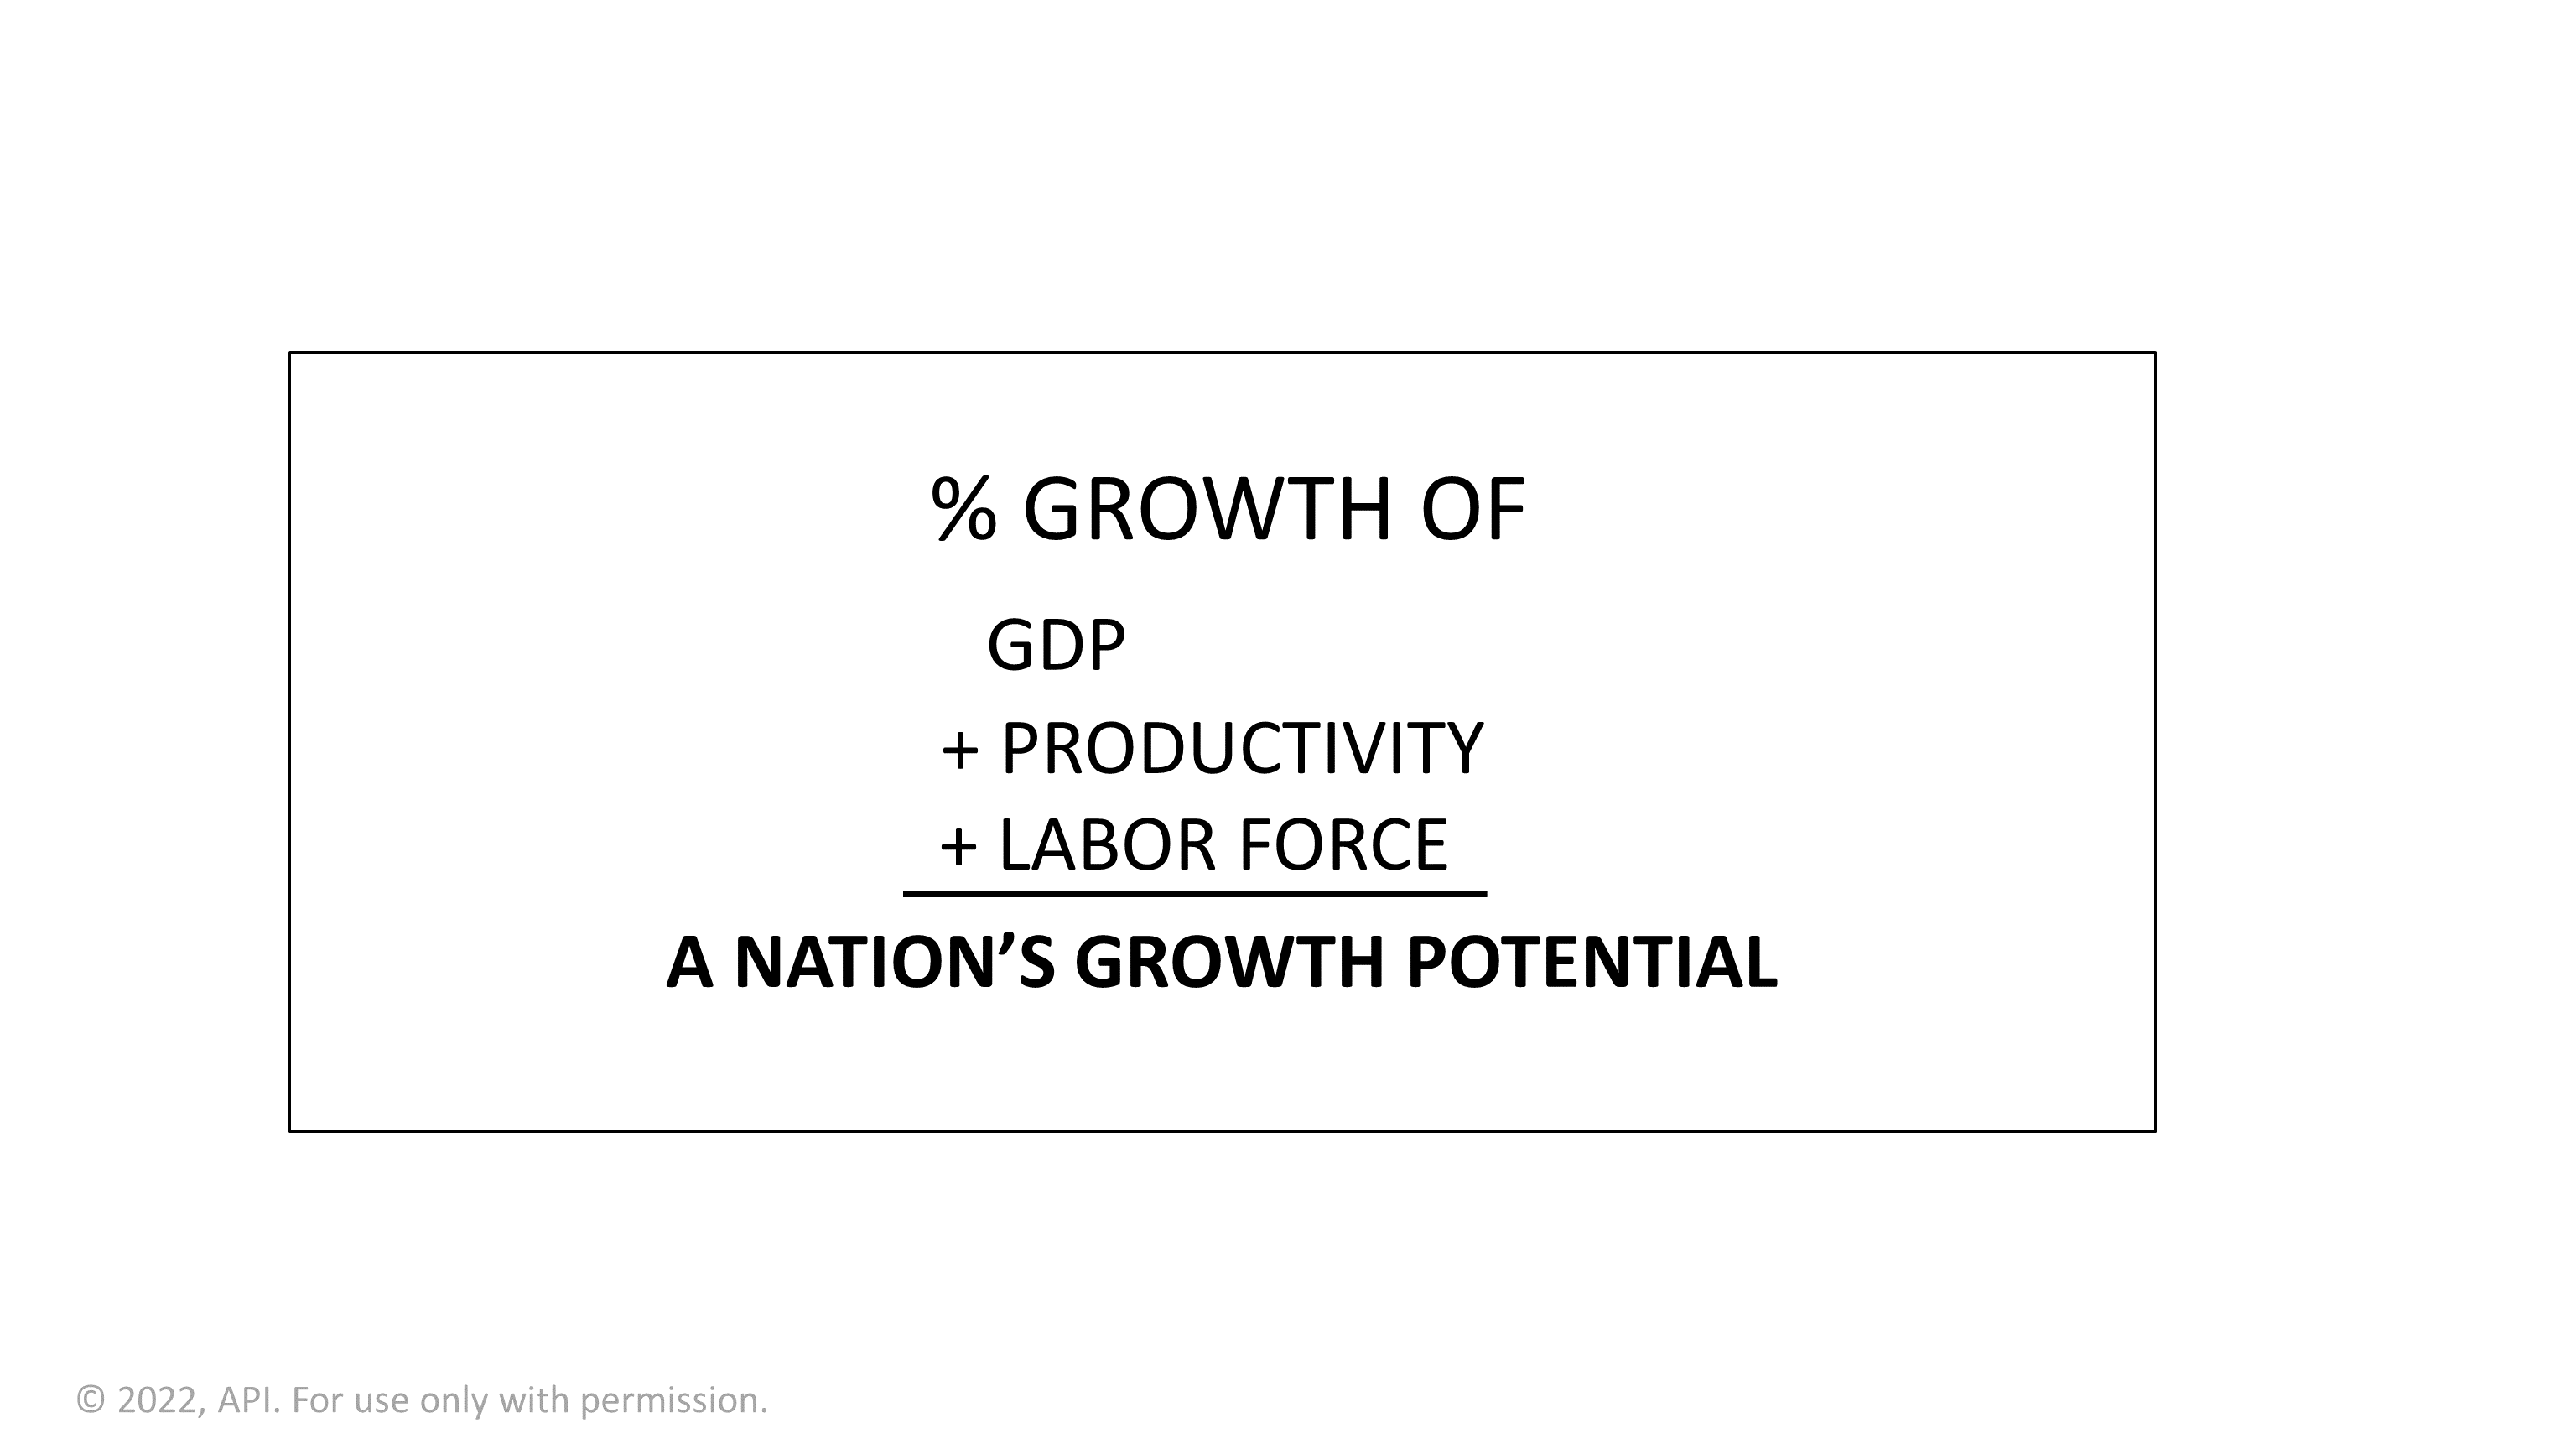
The growth potential of a nation’s economy is the sum of three growth rates: GDP, productivity, and labor force.
This formula boils down a nation’s organic economic strength.

Click image to enlarge
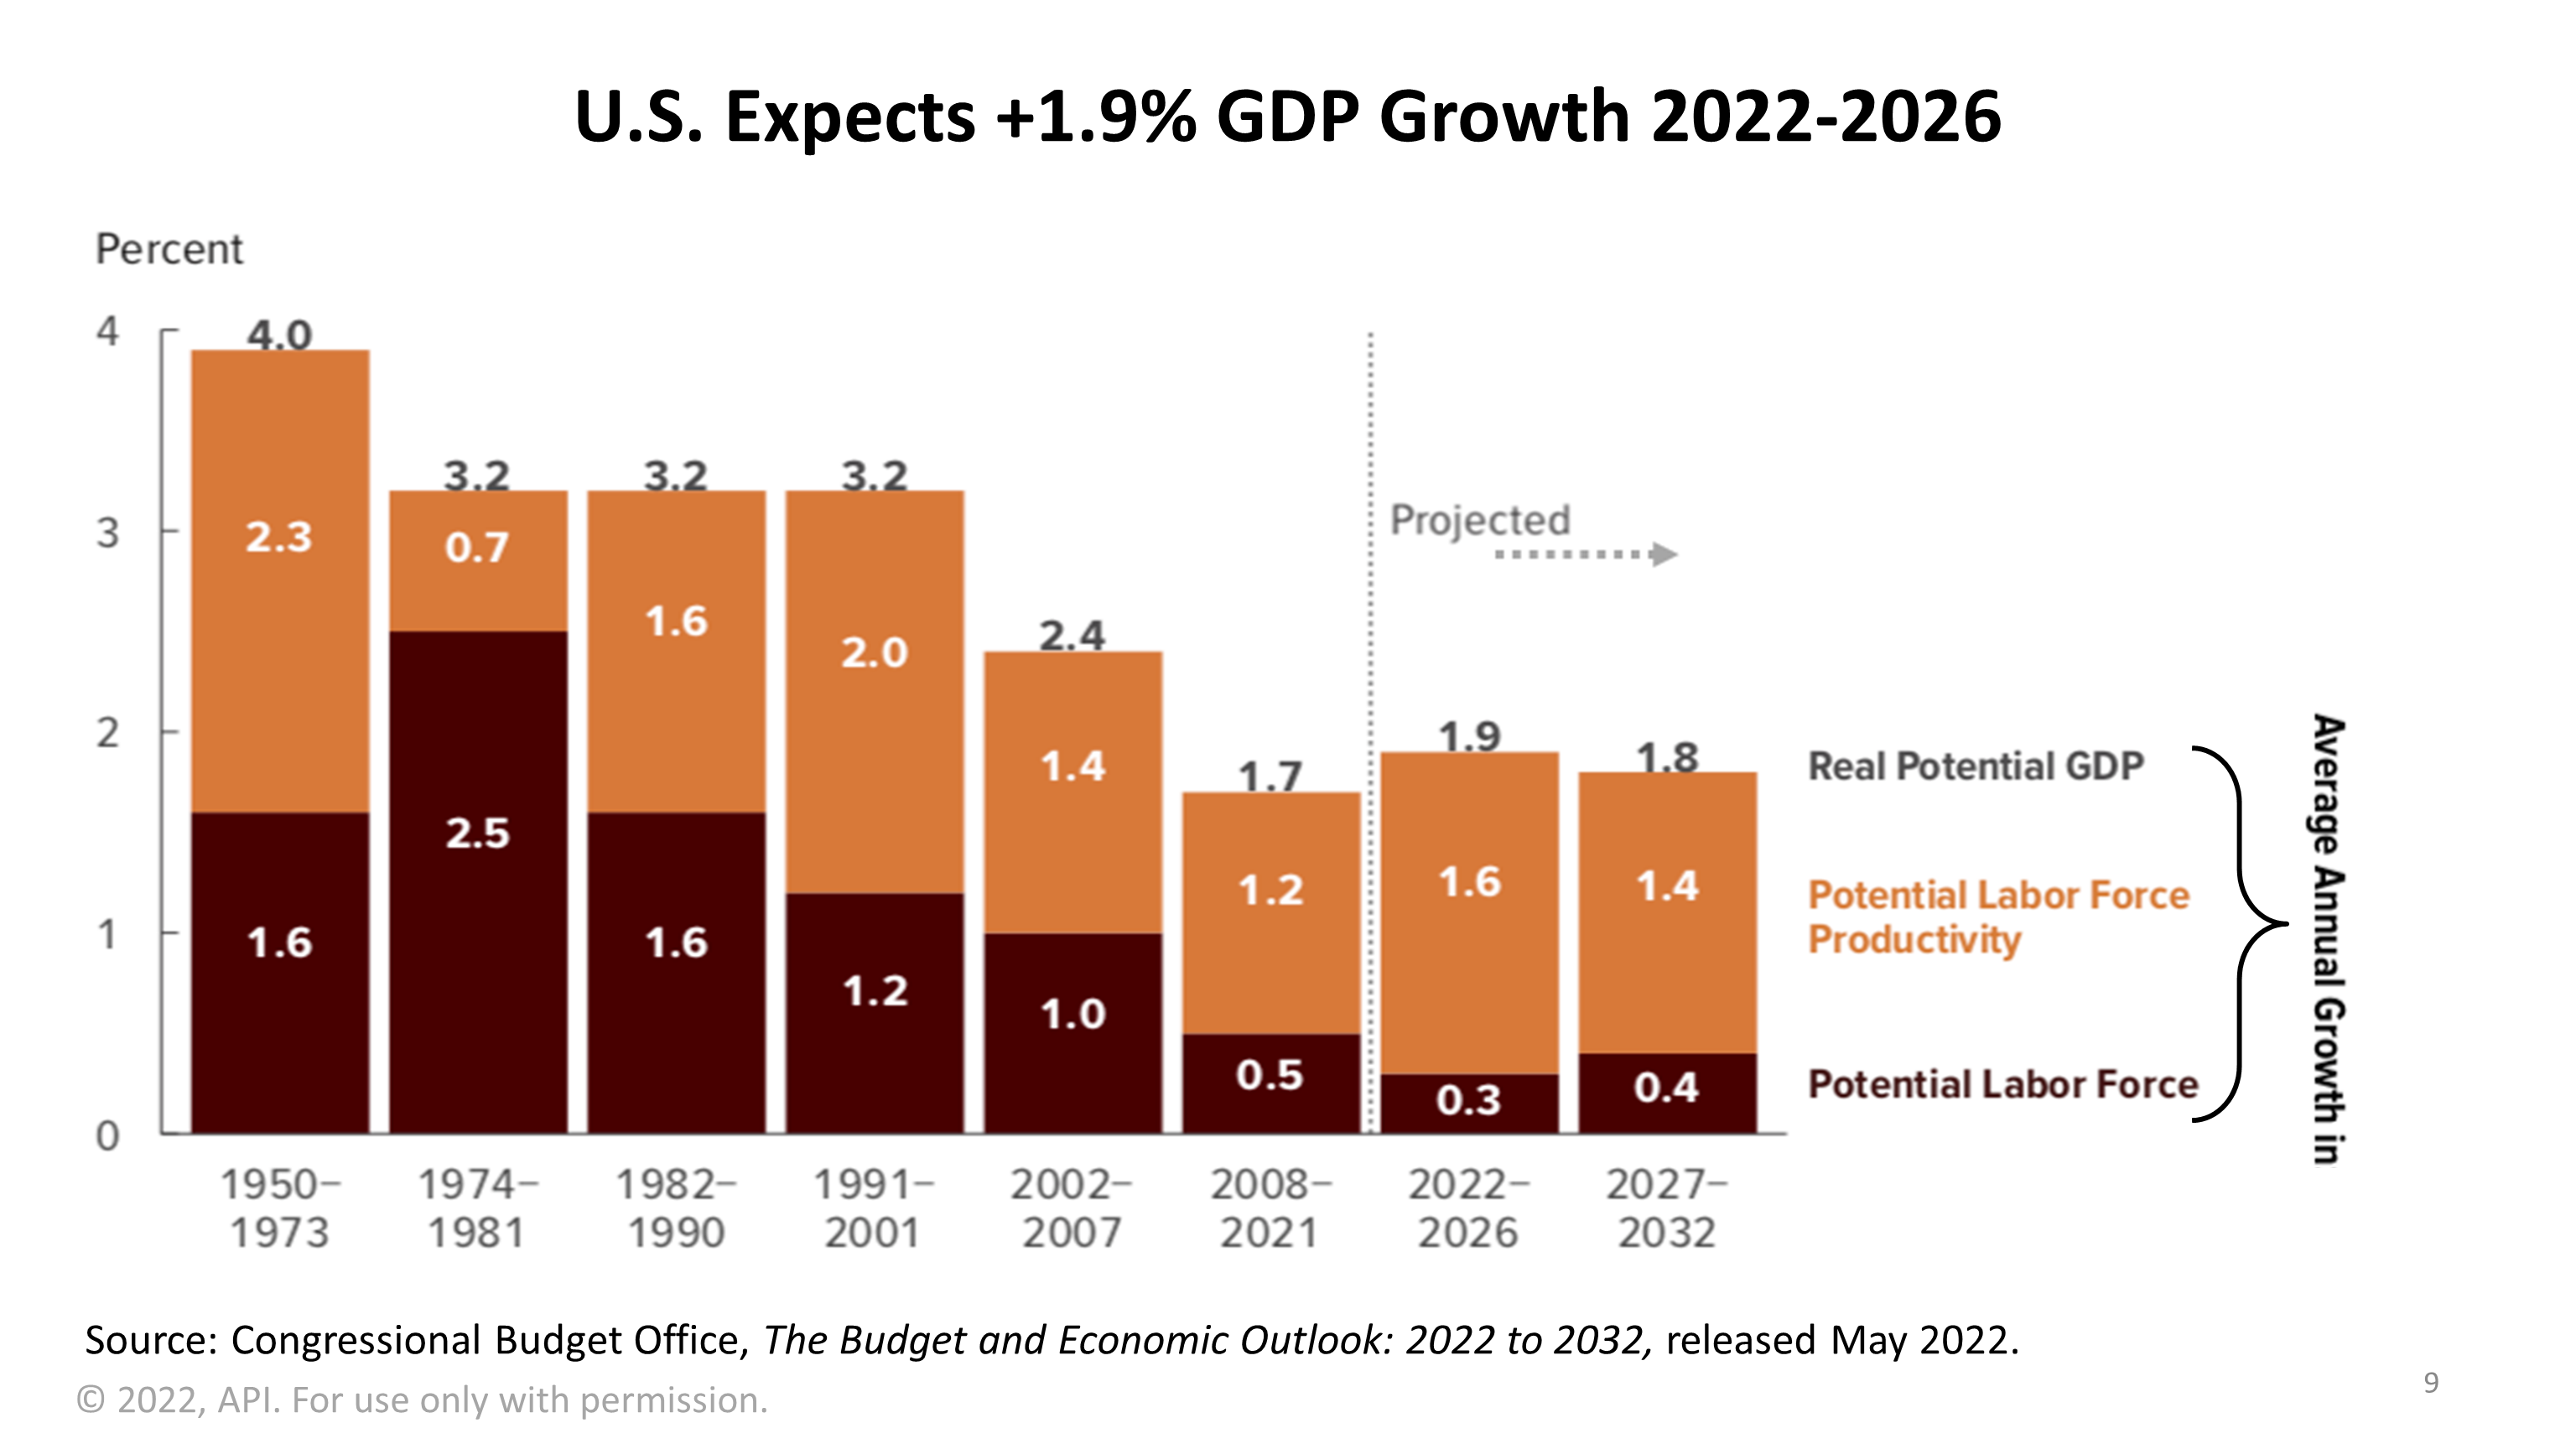
The U.S. has the potential to grow at an average annual rate of +1.9% from 2022 through 2026, according to the latest projections from the Congressional Budget Office (CBO).
That’s the research arm of Congress, which controls spending by the United States government.
CBO is basically the nation’s financial consultant, and it is bipartisan.
Compared to previous decades, this chart makes the growth potential of the U.S. look weak and gloomy.
However, compared to Europe and Japan, the U.S. has much greater long-term growth potential.
Among world economic powers, China has the highest long-term growth potential.
However, investing in China’s economy is very risky because markets are government controlled.
American capitalism and the U.S. system of government continue to make the S&P 500 index the best equity investment over the long run worldwide.

Click image to enlarge
Okay, now that we’ve offered a bit of perspective, let’s look at the dismal performance in the second quarter of 2022.

Click image to enlarge
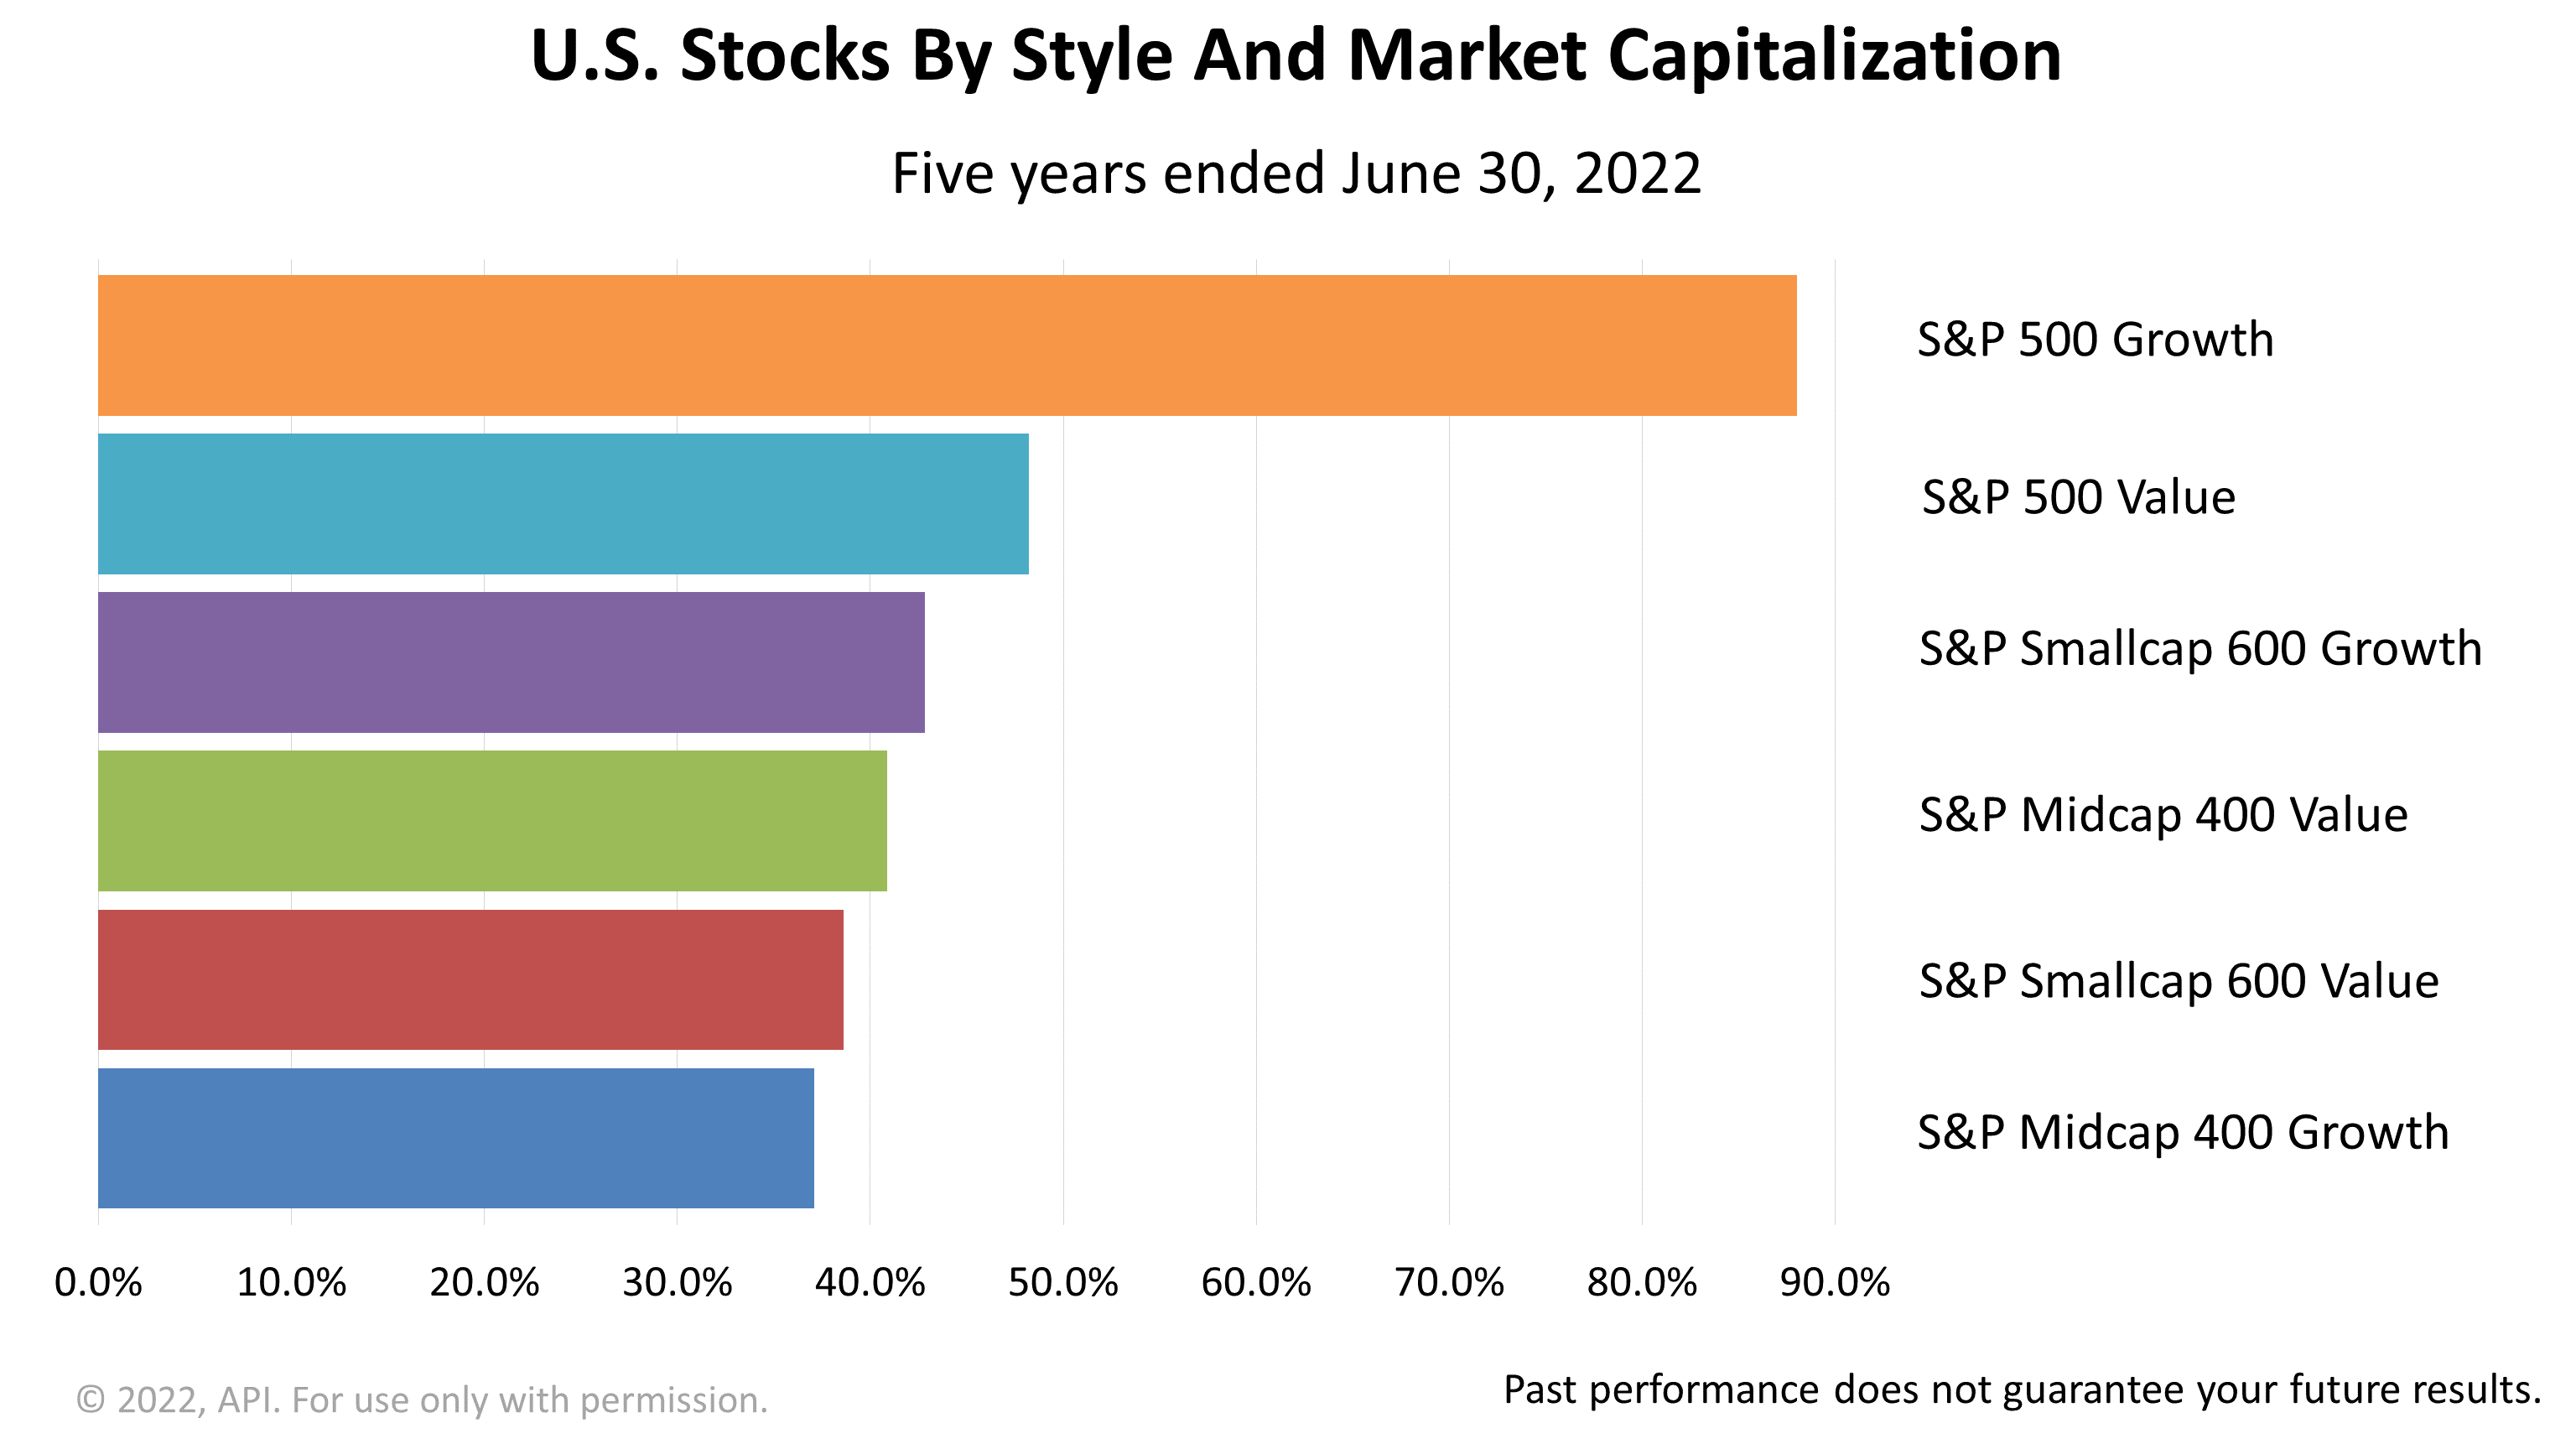
This chart examines U.S. stock performance by their size and growth characteristics.
Large-cap growth stocks, leaders of the bull market since COVID struck in February 2020, were the big losers in 2Q22.
Large-cap value stocks declined about half as much as large growth.
Click image to enlarge
Three months of performance data is not enough to show a trend, but it indicates it is useful to get a snapshot of what just happened in the last 12 weeks.
Click image to enlarge
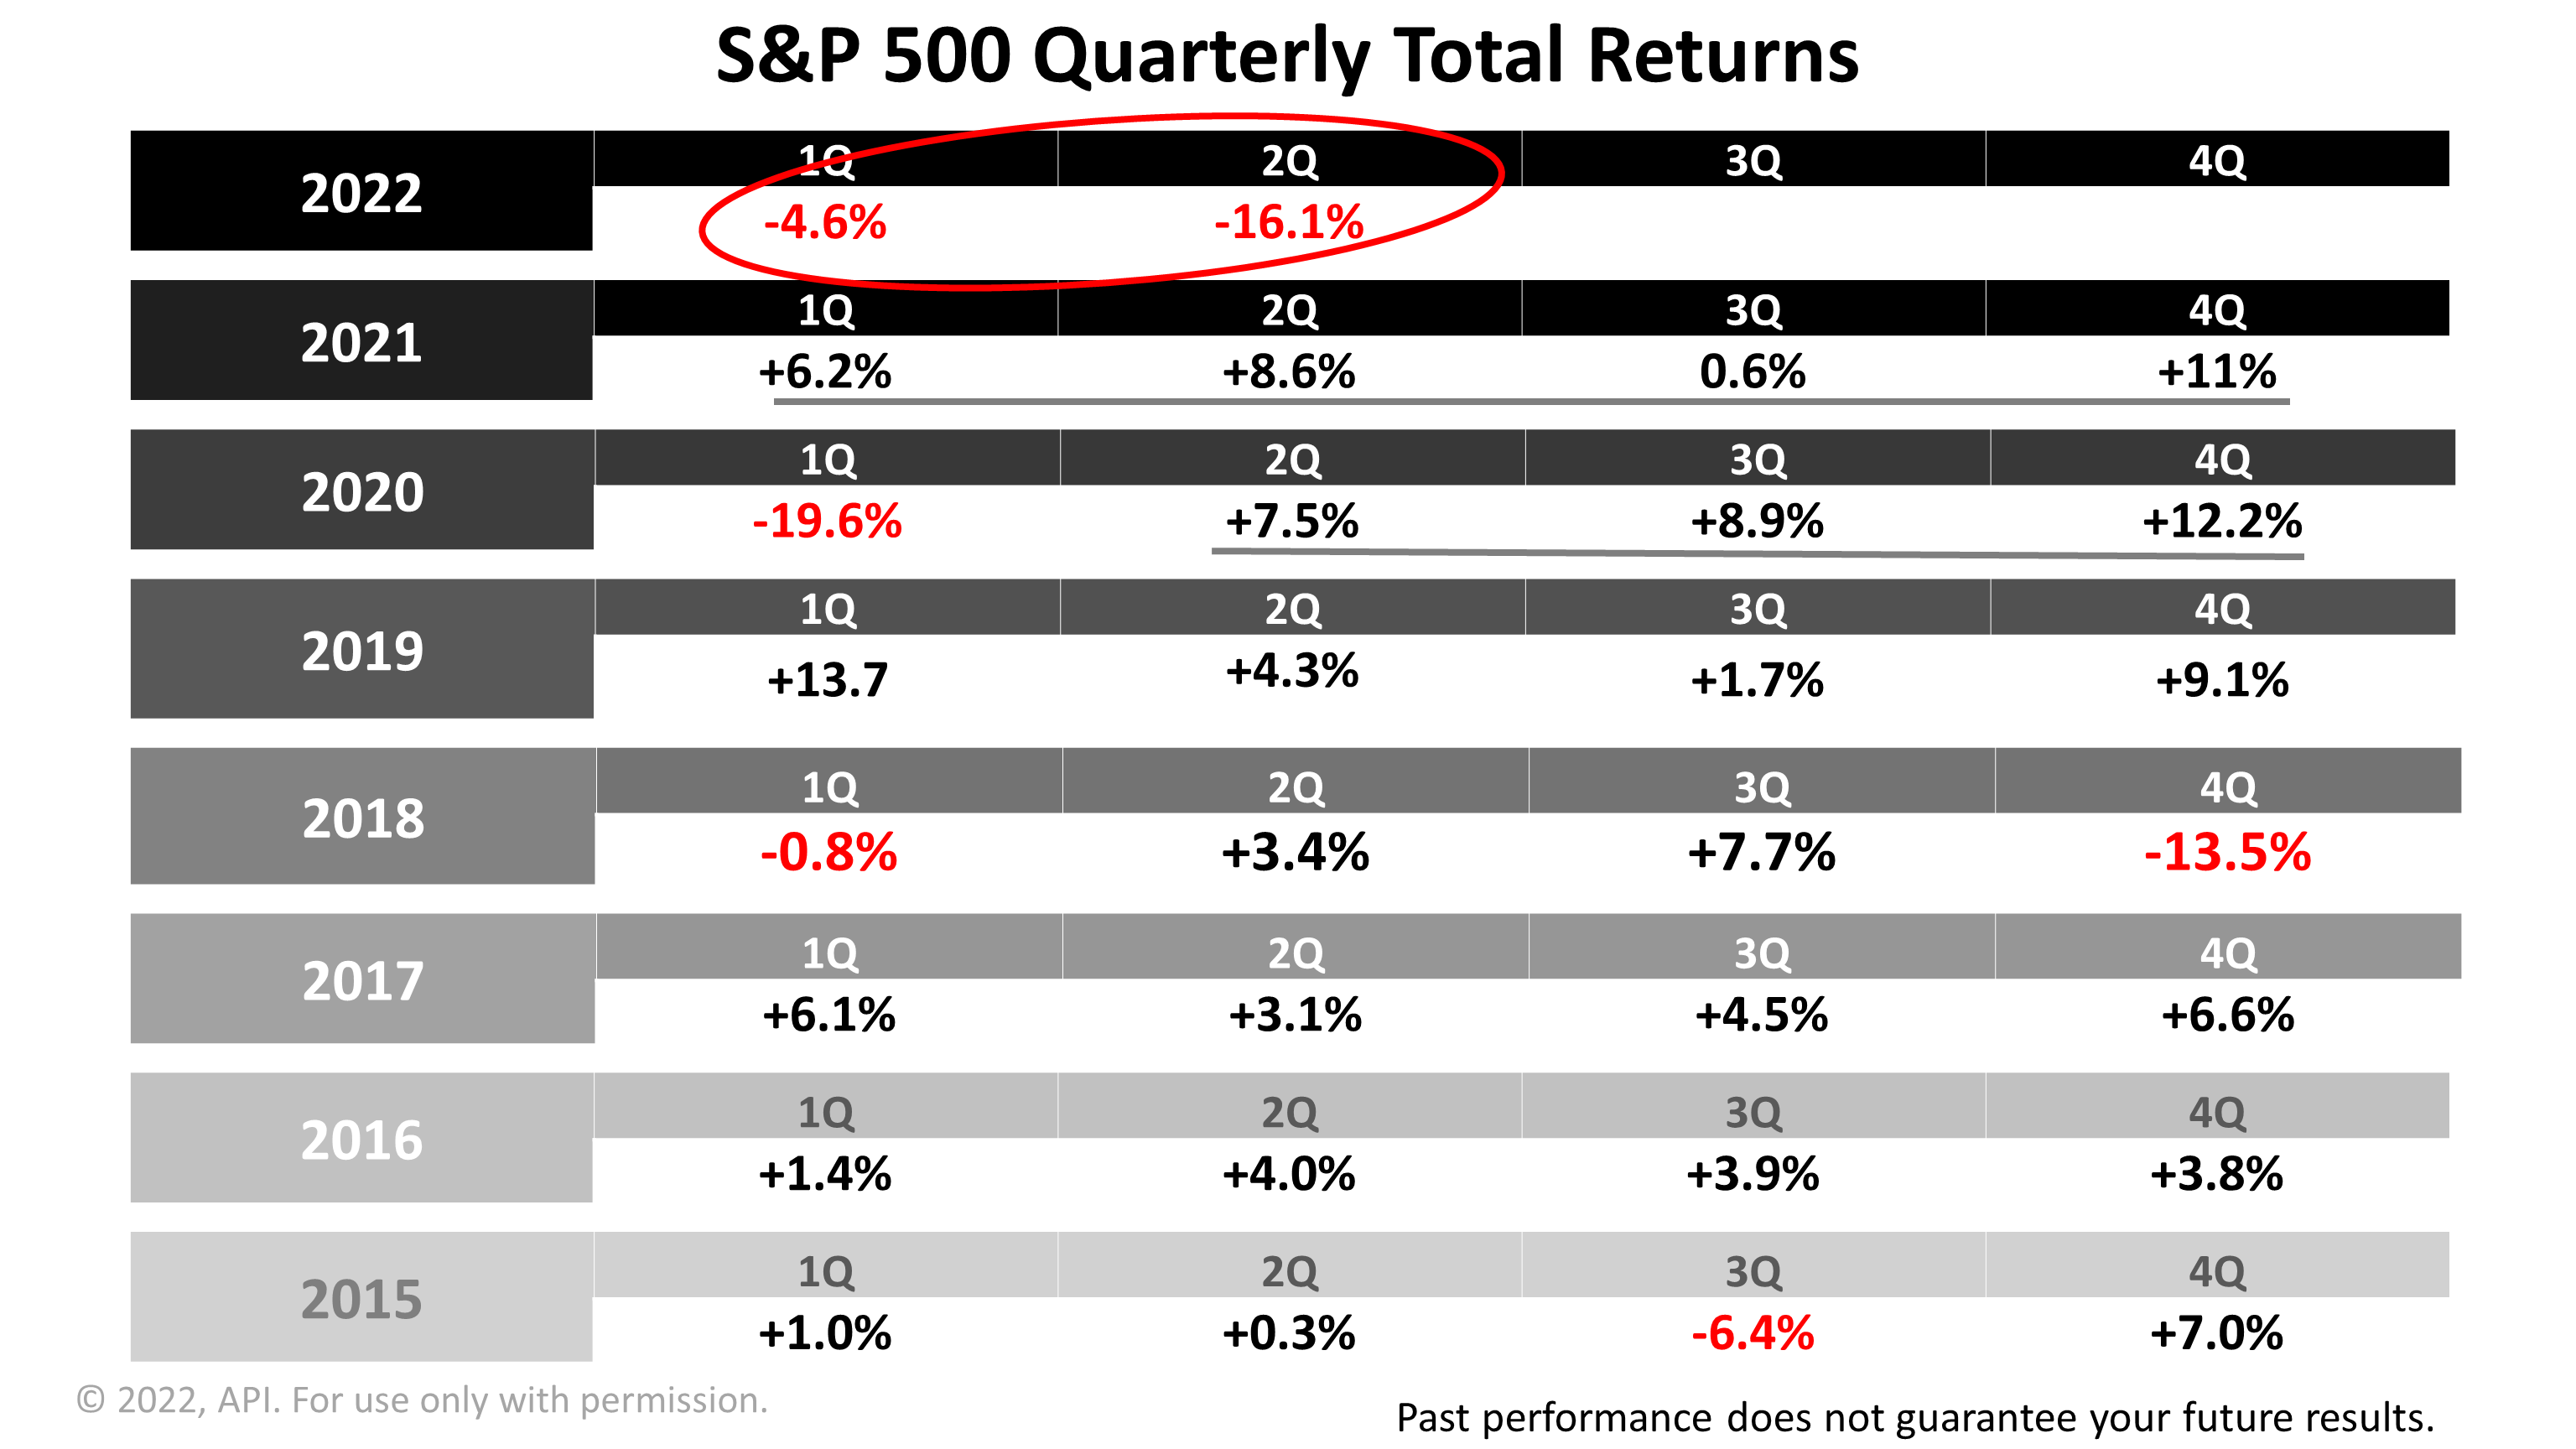
A -16.1% three-month loss in the second quarter of 2022—now, that does stand out.
Let’s look back at the quarterly table.
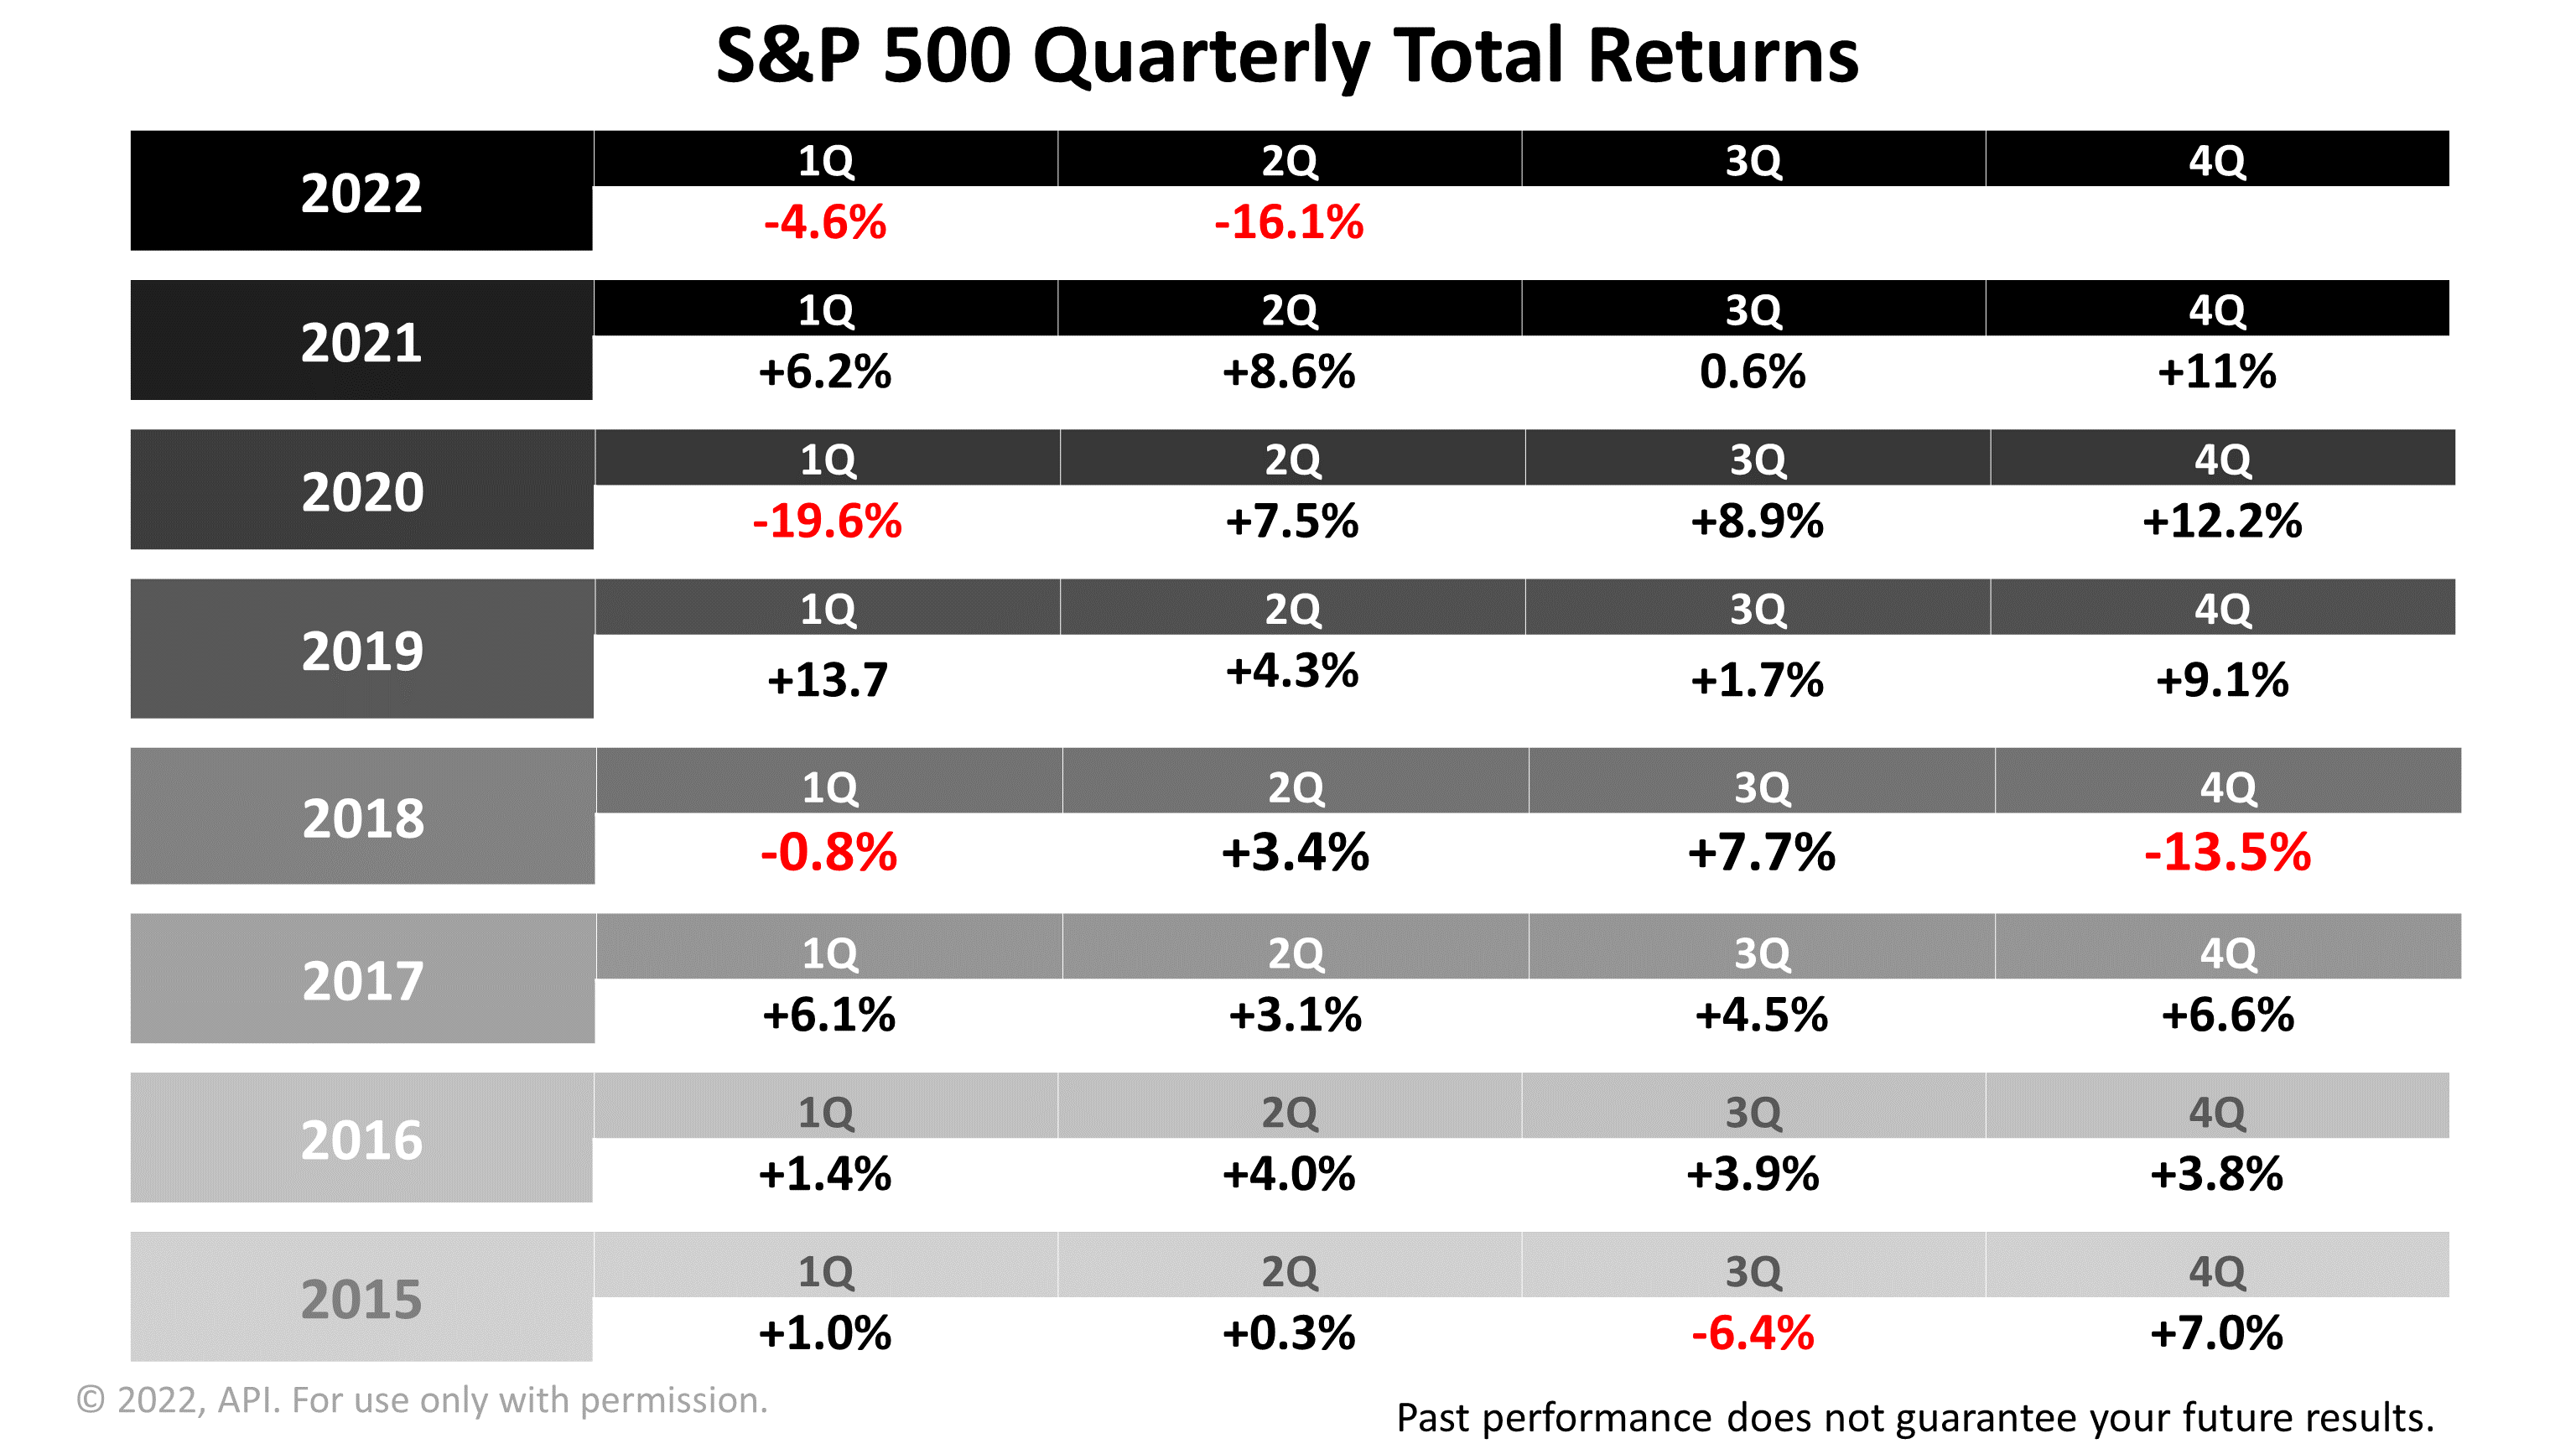
Click image to enlarge
The -16.1% loss in the second quarter of 2022 rivaled the -19.6% plunge in the first quarter of 2020, when the pandemic first hit.
Could we have another losing quarter in 3Q 2022?
No one can predict the future, but we’ll talk later about the likelihood of another stock market loss in the third quarter.
Click image to enlarge
Click image to enlarge
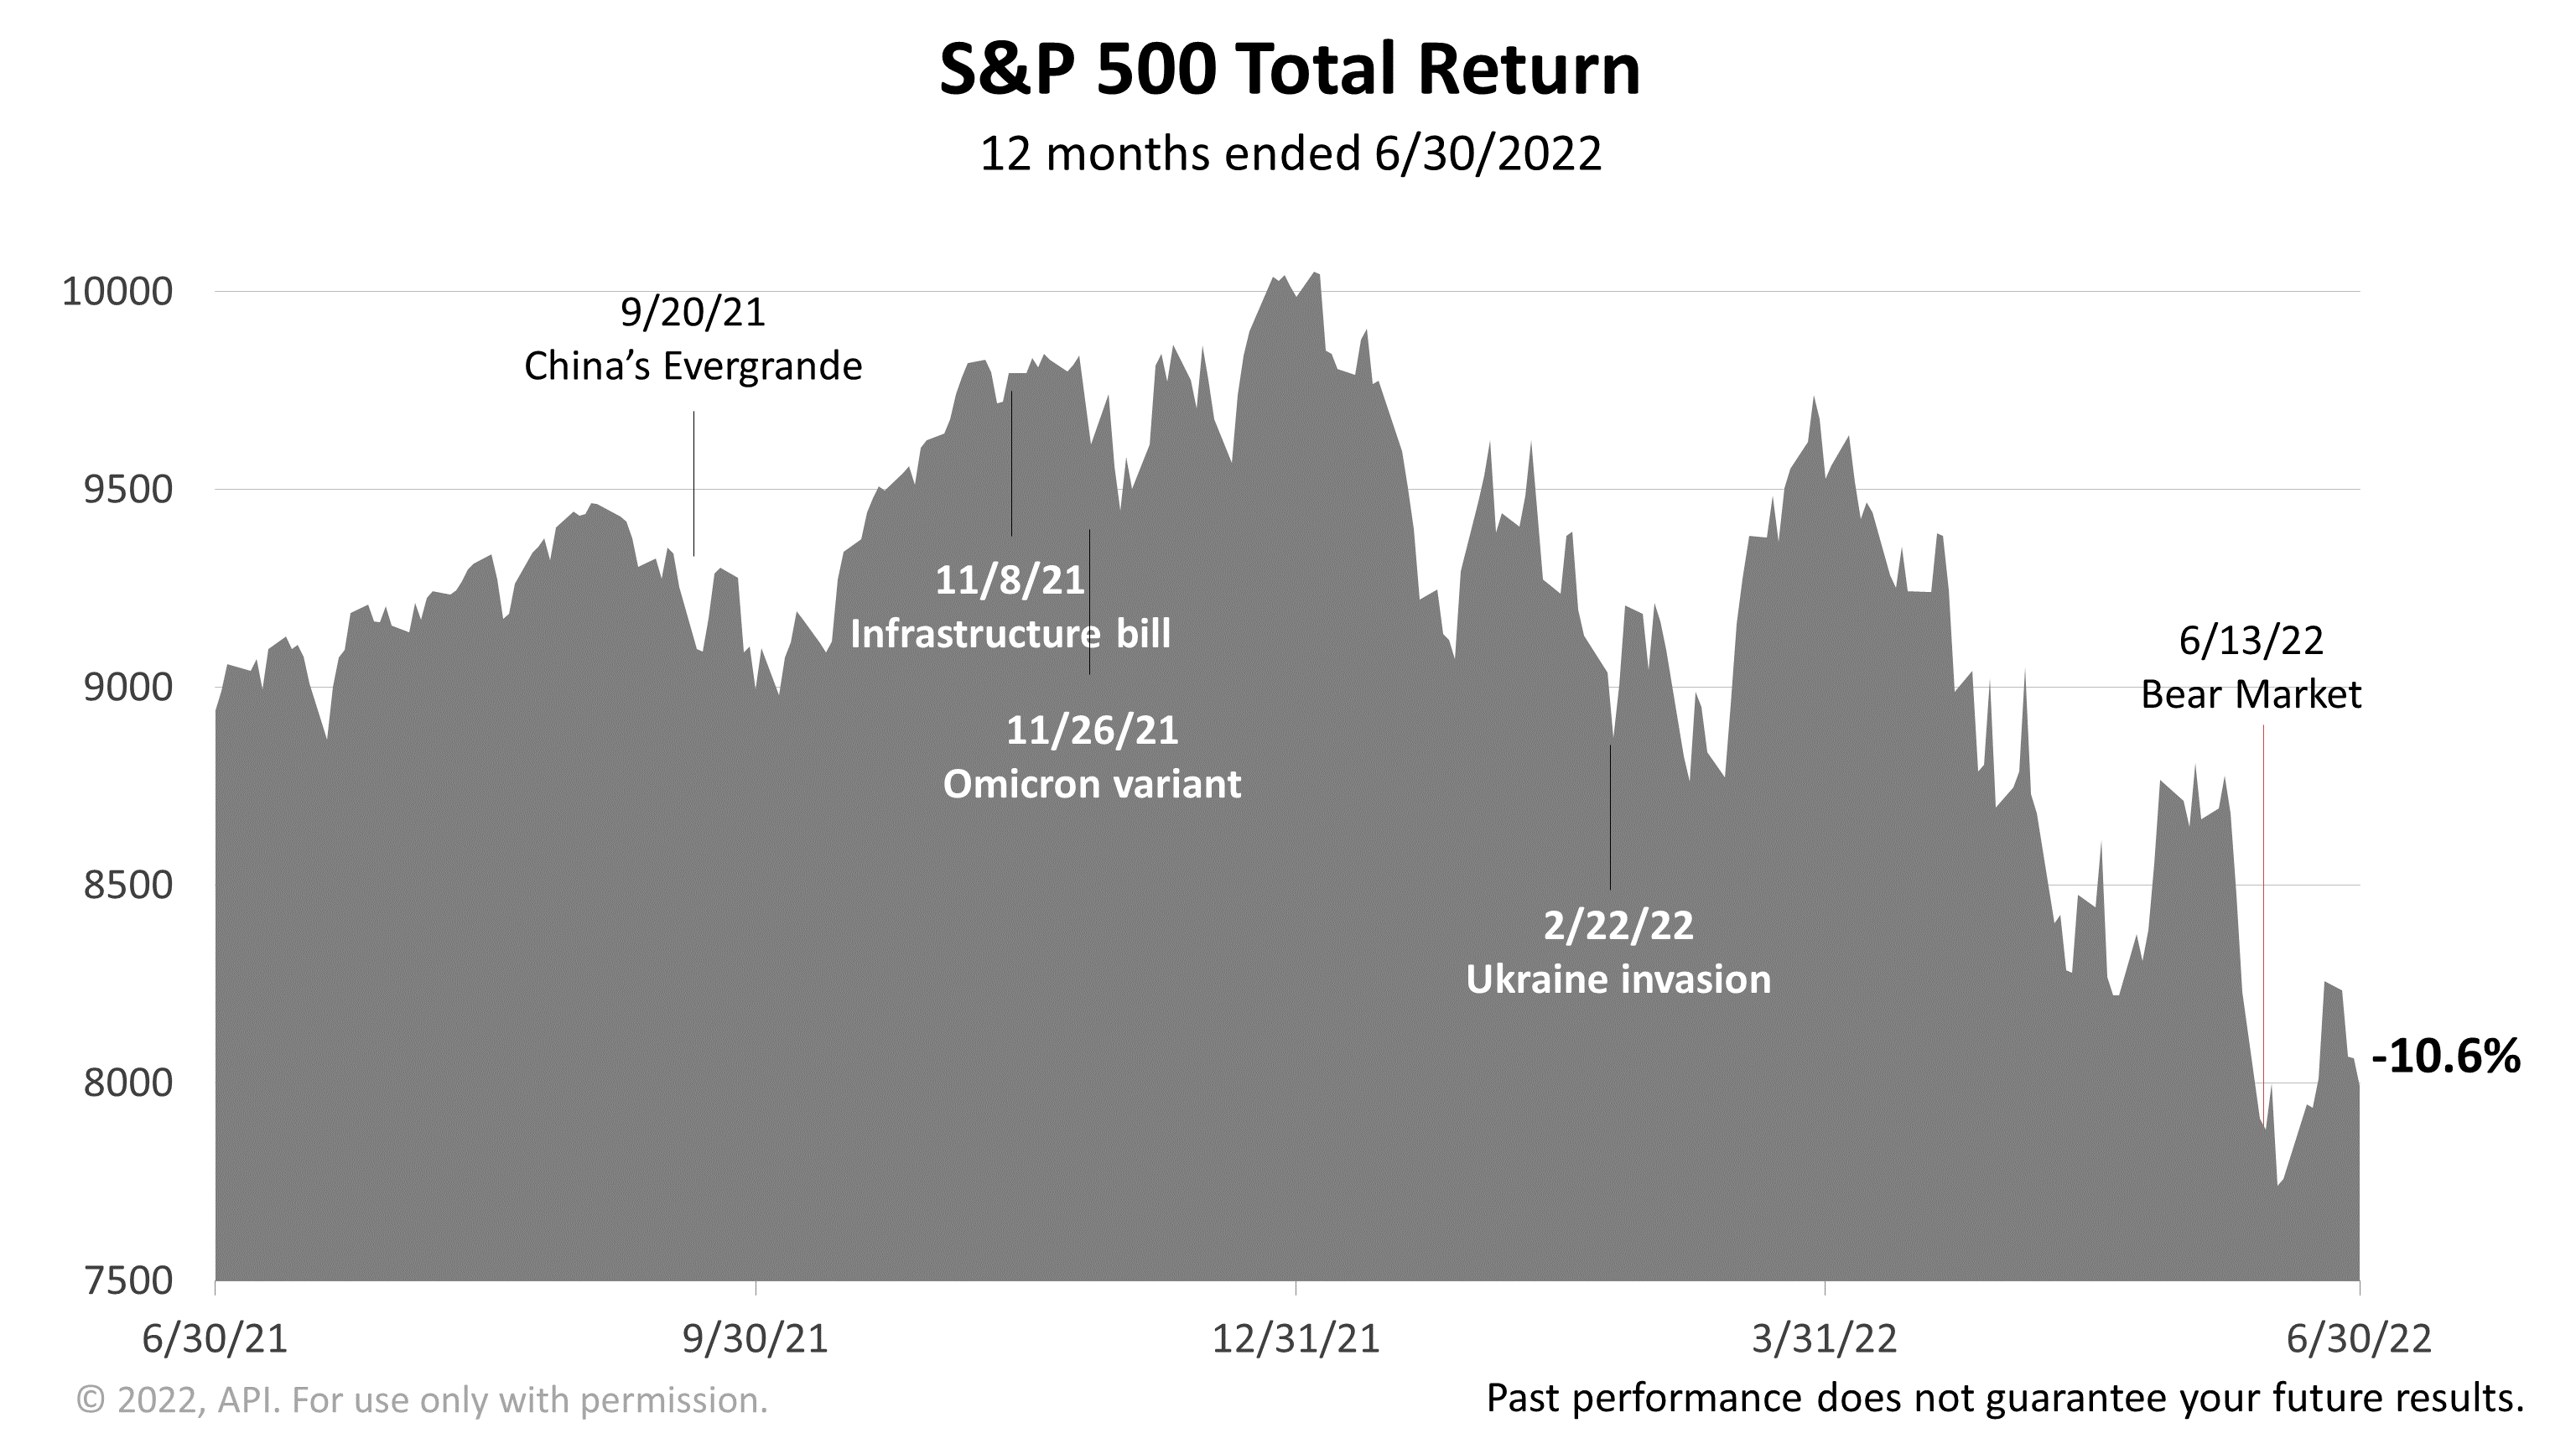
In the 12 months ended June 30, 2022, the S&P 500 lost -10.6%.
It was a one-year span with difficult headlines.
One of the largest real estate companies in China could not meet its financial obligations and was reined in by the government.
The Omicron variant swept the nation.
Inflation rose to a four-decade high.
And a bear market officially began on June 13, 2022, when the S&P 500 closed more than -20% lower than its all-time high of Jan. 3, 2022.
Click image to enlarge
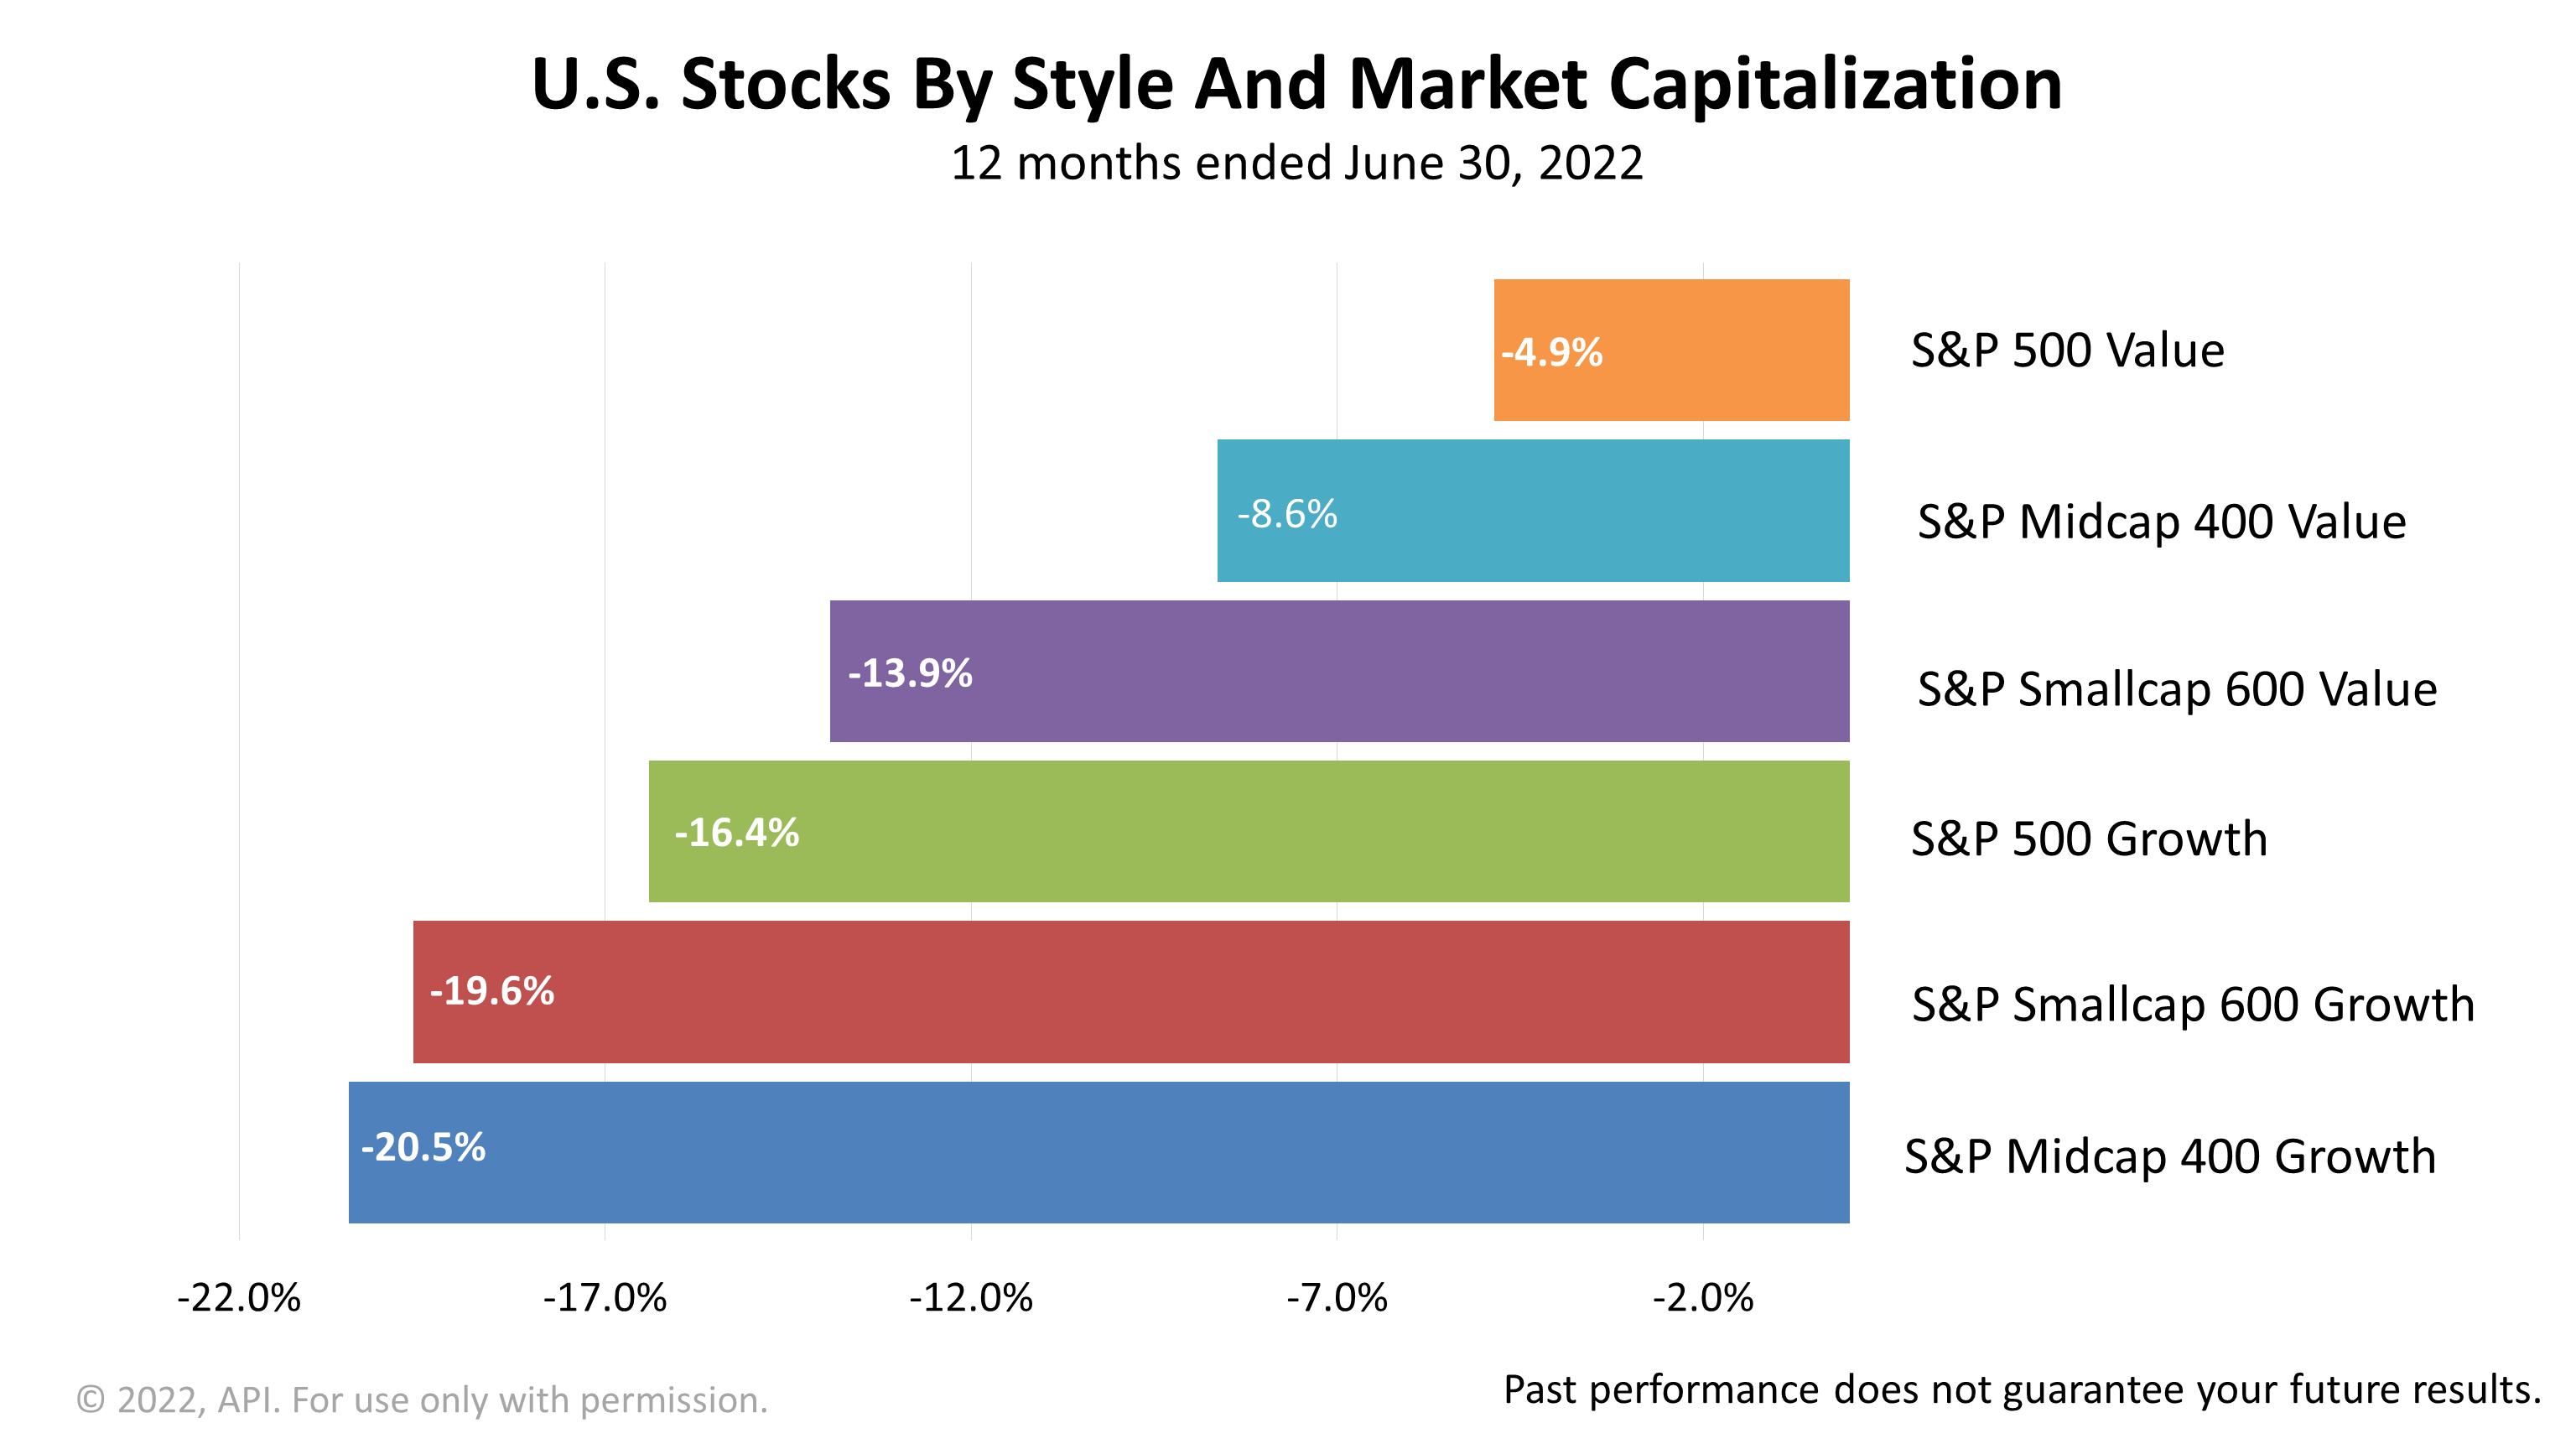
For the year ended June 30, 2022, growth stocks were bigger losers than value-style stocks.
Valuations on growth stocks rise in an expanding economy, when investors are more willing to pay a higher price multiple for a company’s earnings.
However, in a bear market and weakening economy, growth is less important than avoiding losses, and investors favor companies priced at lower price-earnings multiples but with stable earnings.
The cycle of investors bidding up prices on growth companies in economic expansions and then paying up for value stocks in recessions is predictable.
What’s completely unpredictable is the timing.

Click image to enlarge
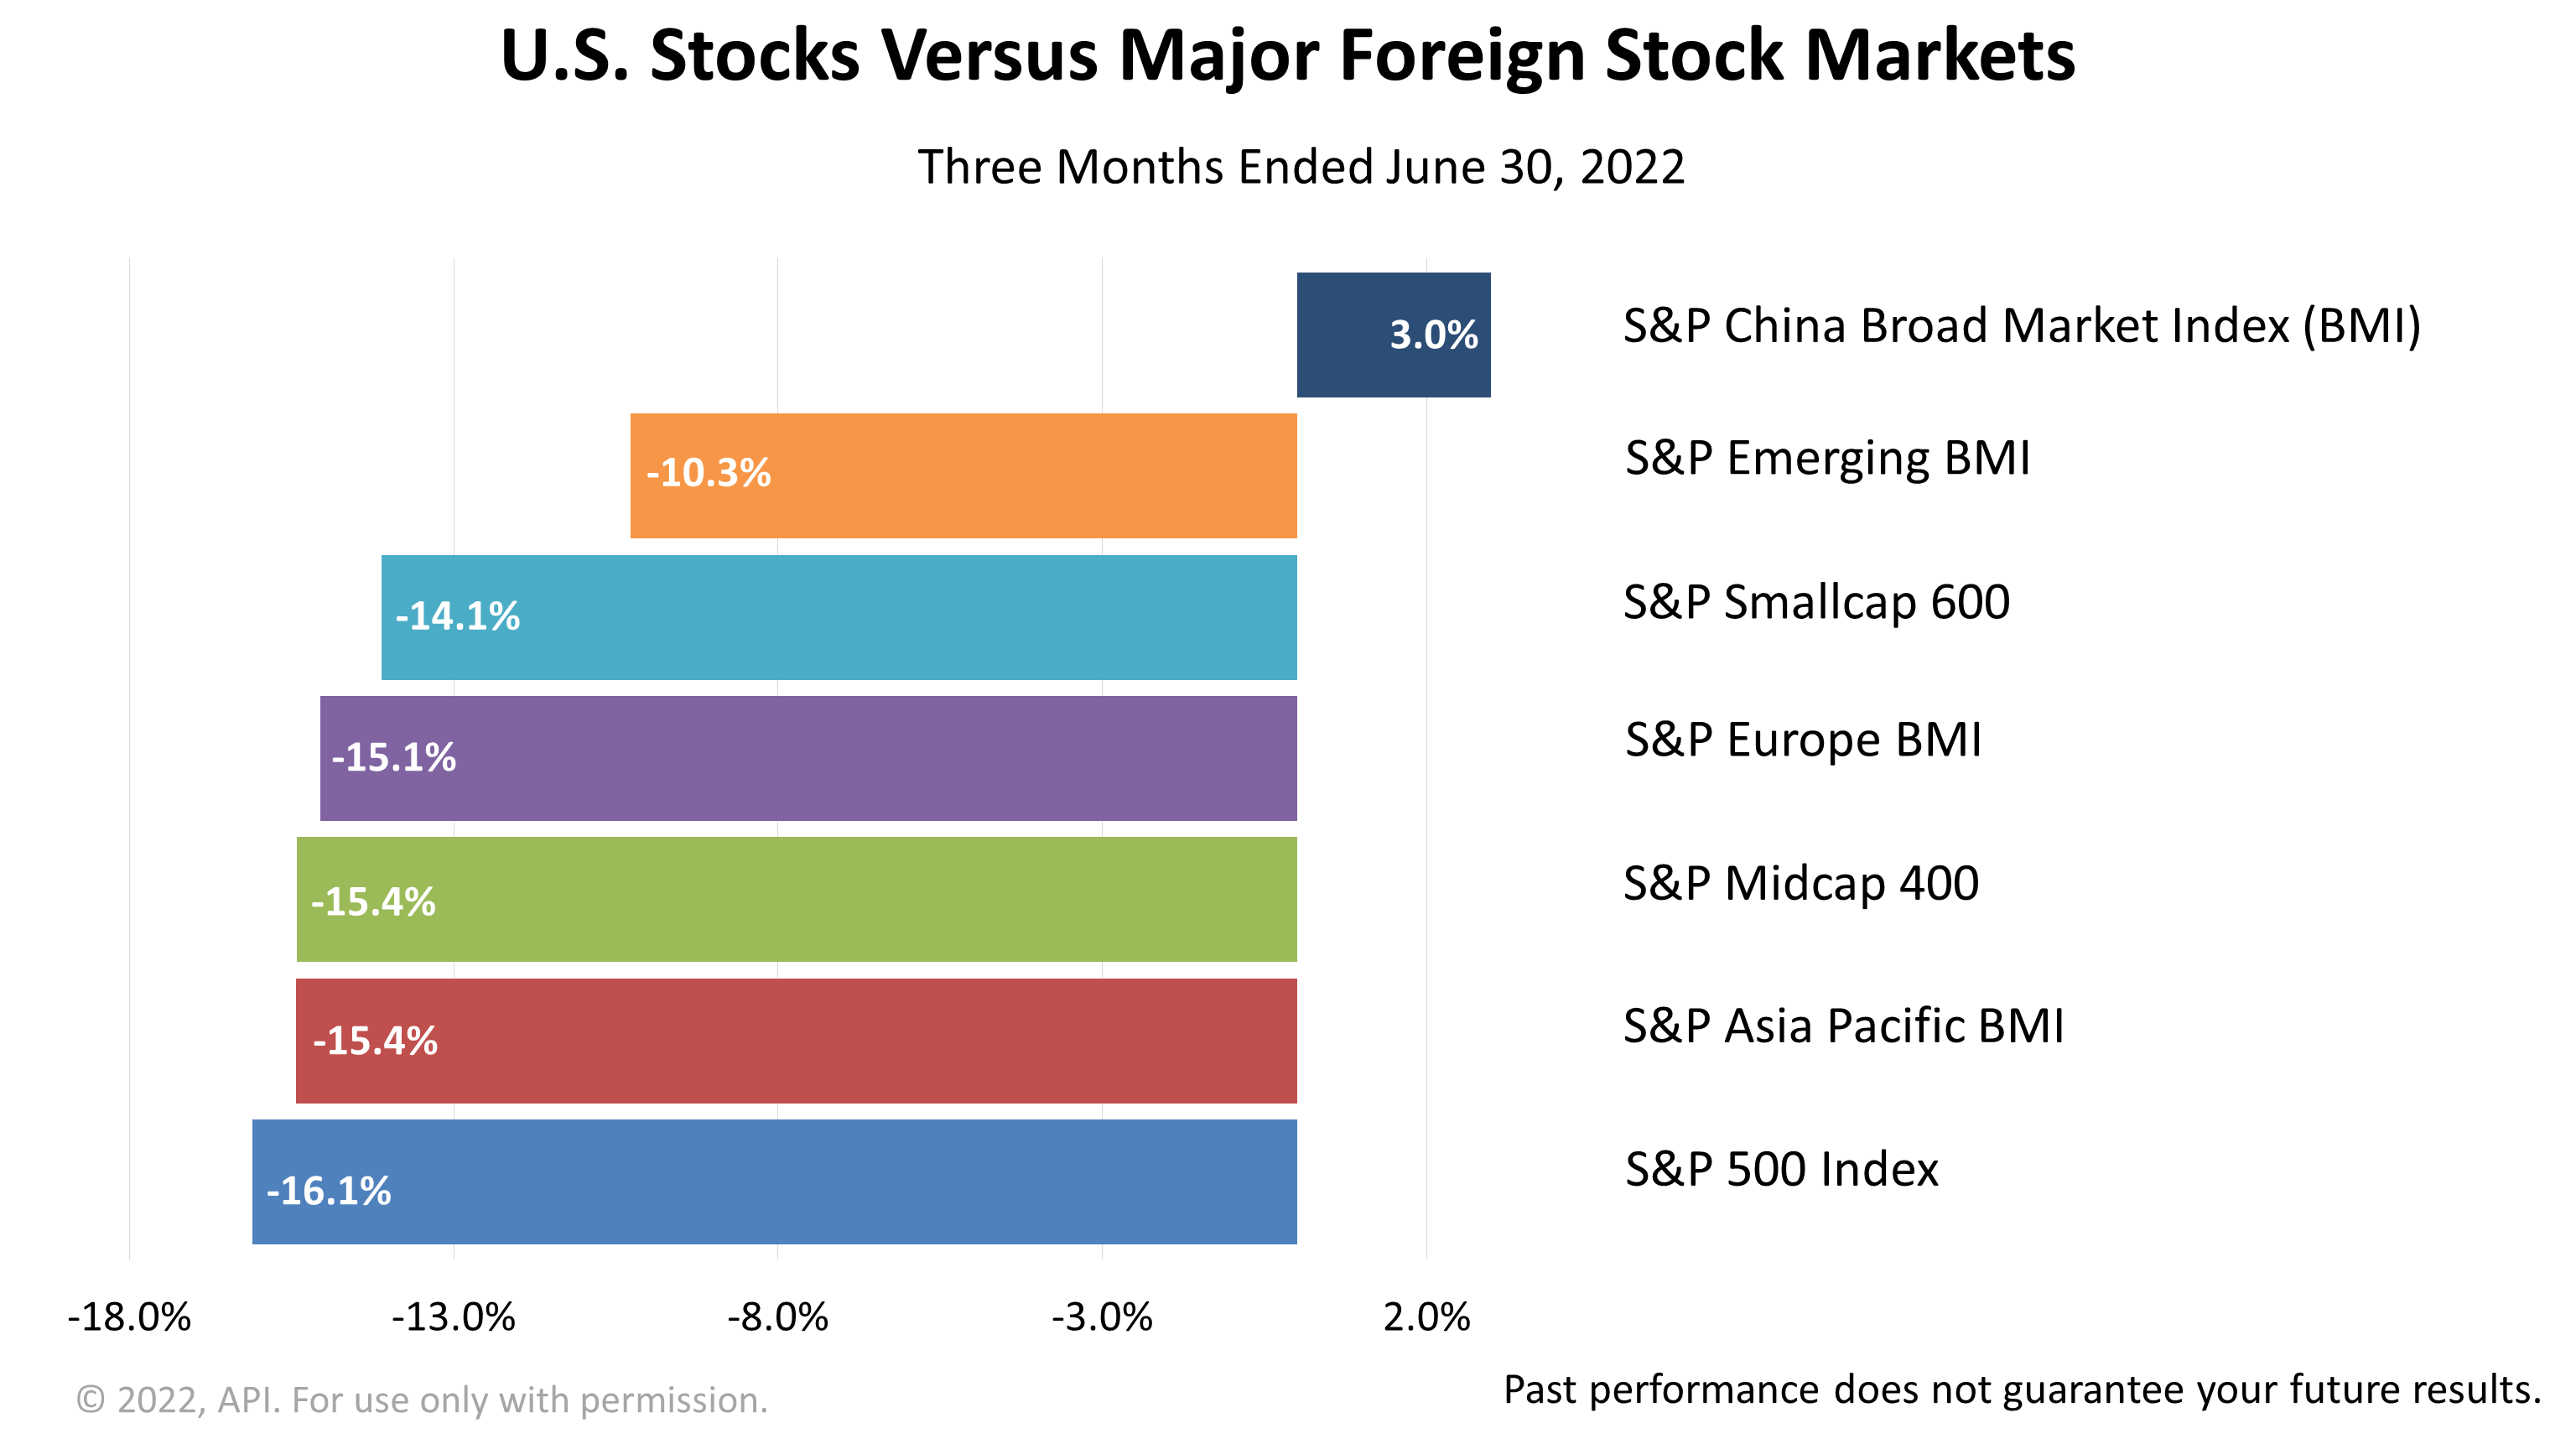
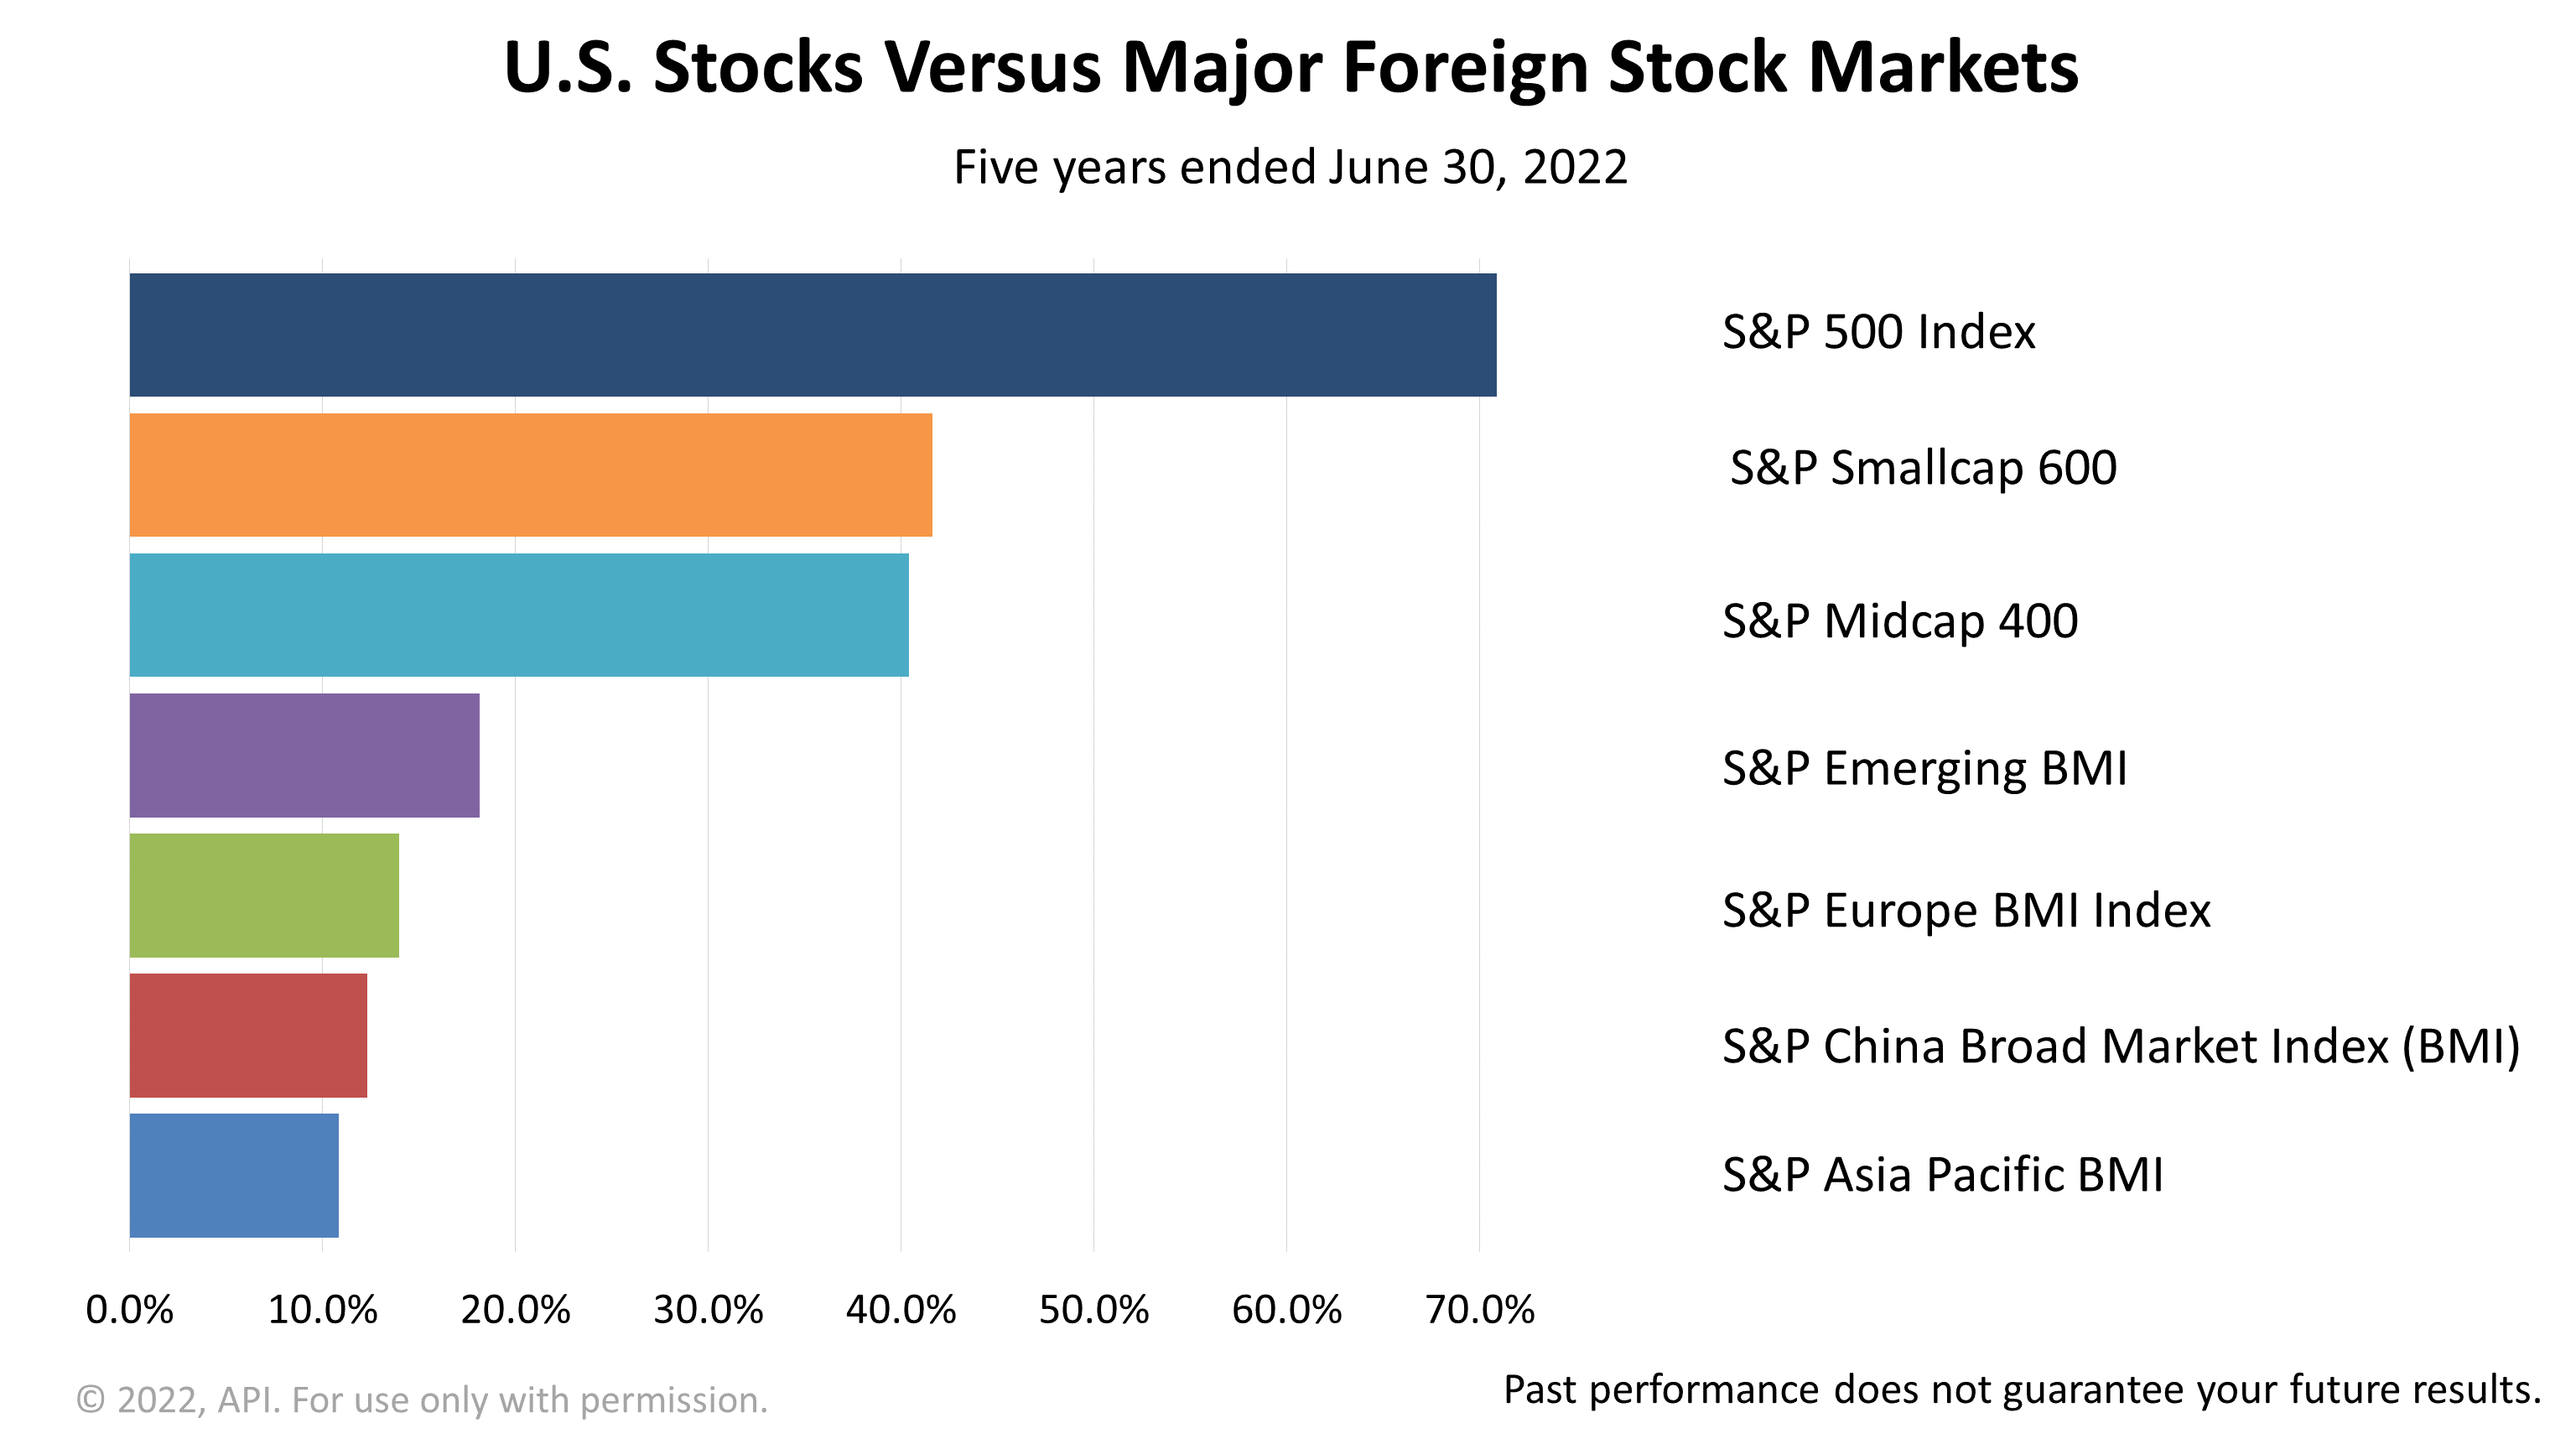
Looking at U.S. stocks versus other regional stock markets of the world, China was the laggard in the 12 months ended June 30, 2022, with a -30.5% loss—three times the drop in the S&P 500.
Emerging markets, which are dominated by Chinese equities, lost -22.1%, while indexes representing stocks in Europe and Asia Pacific lost, respectively, -21.7% and -19%.
Click image to enlarge
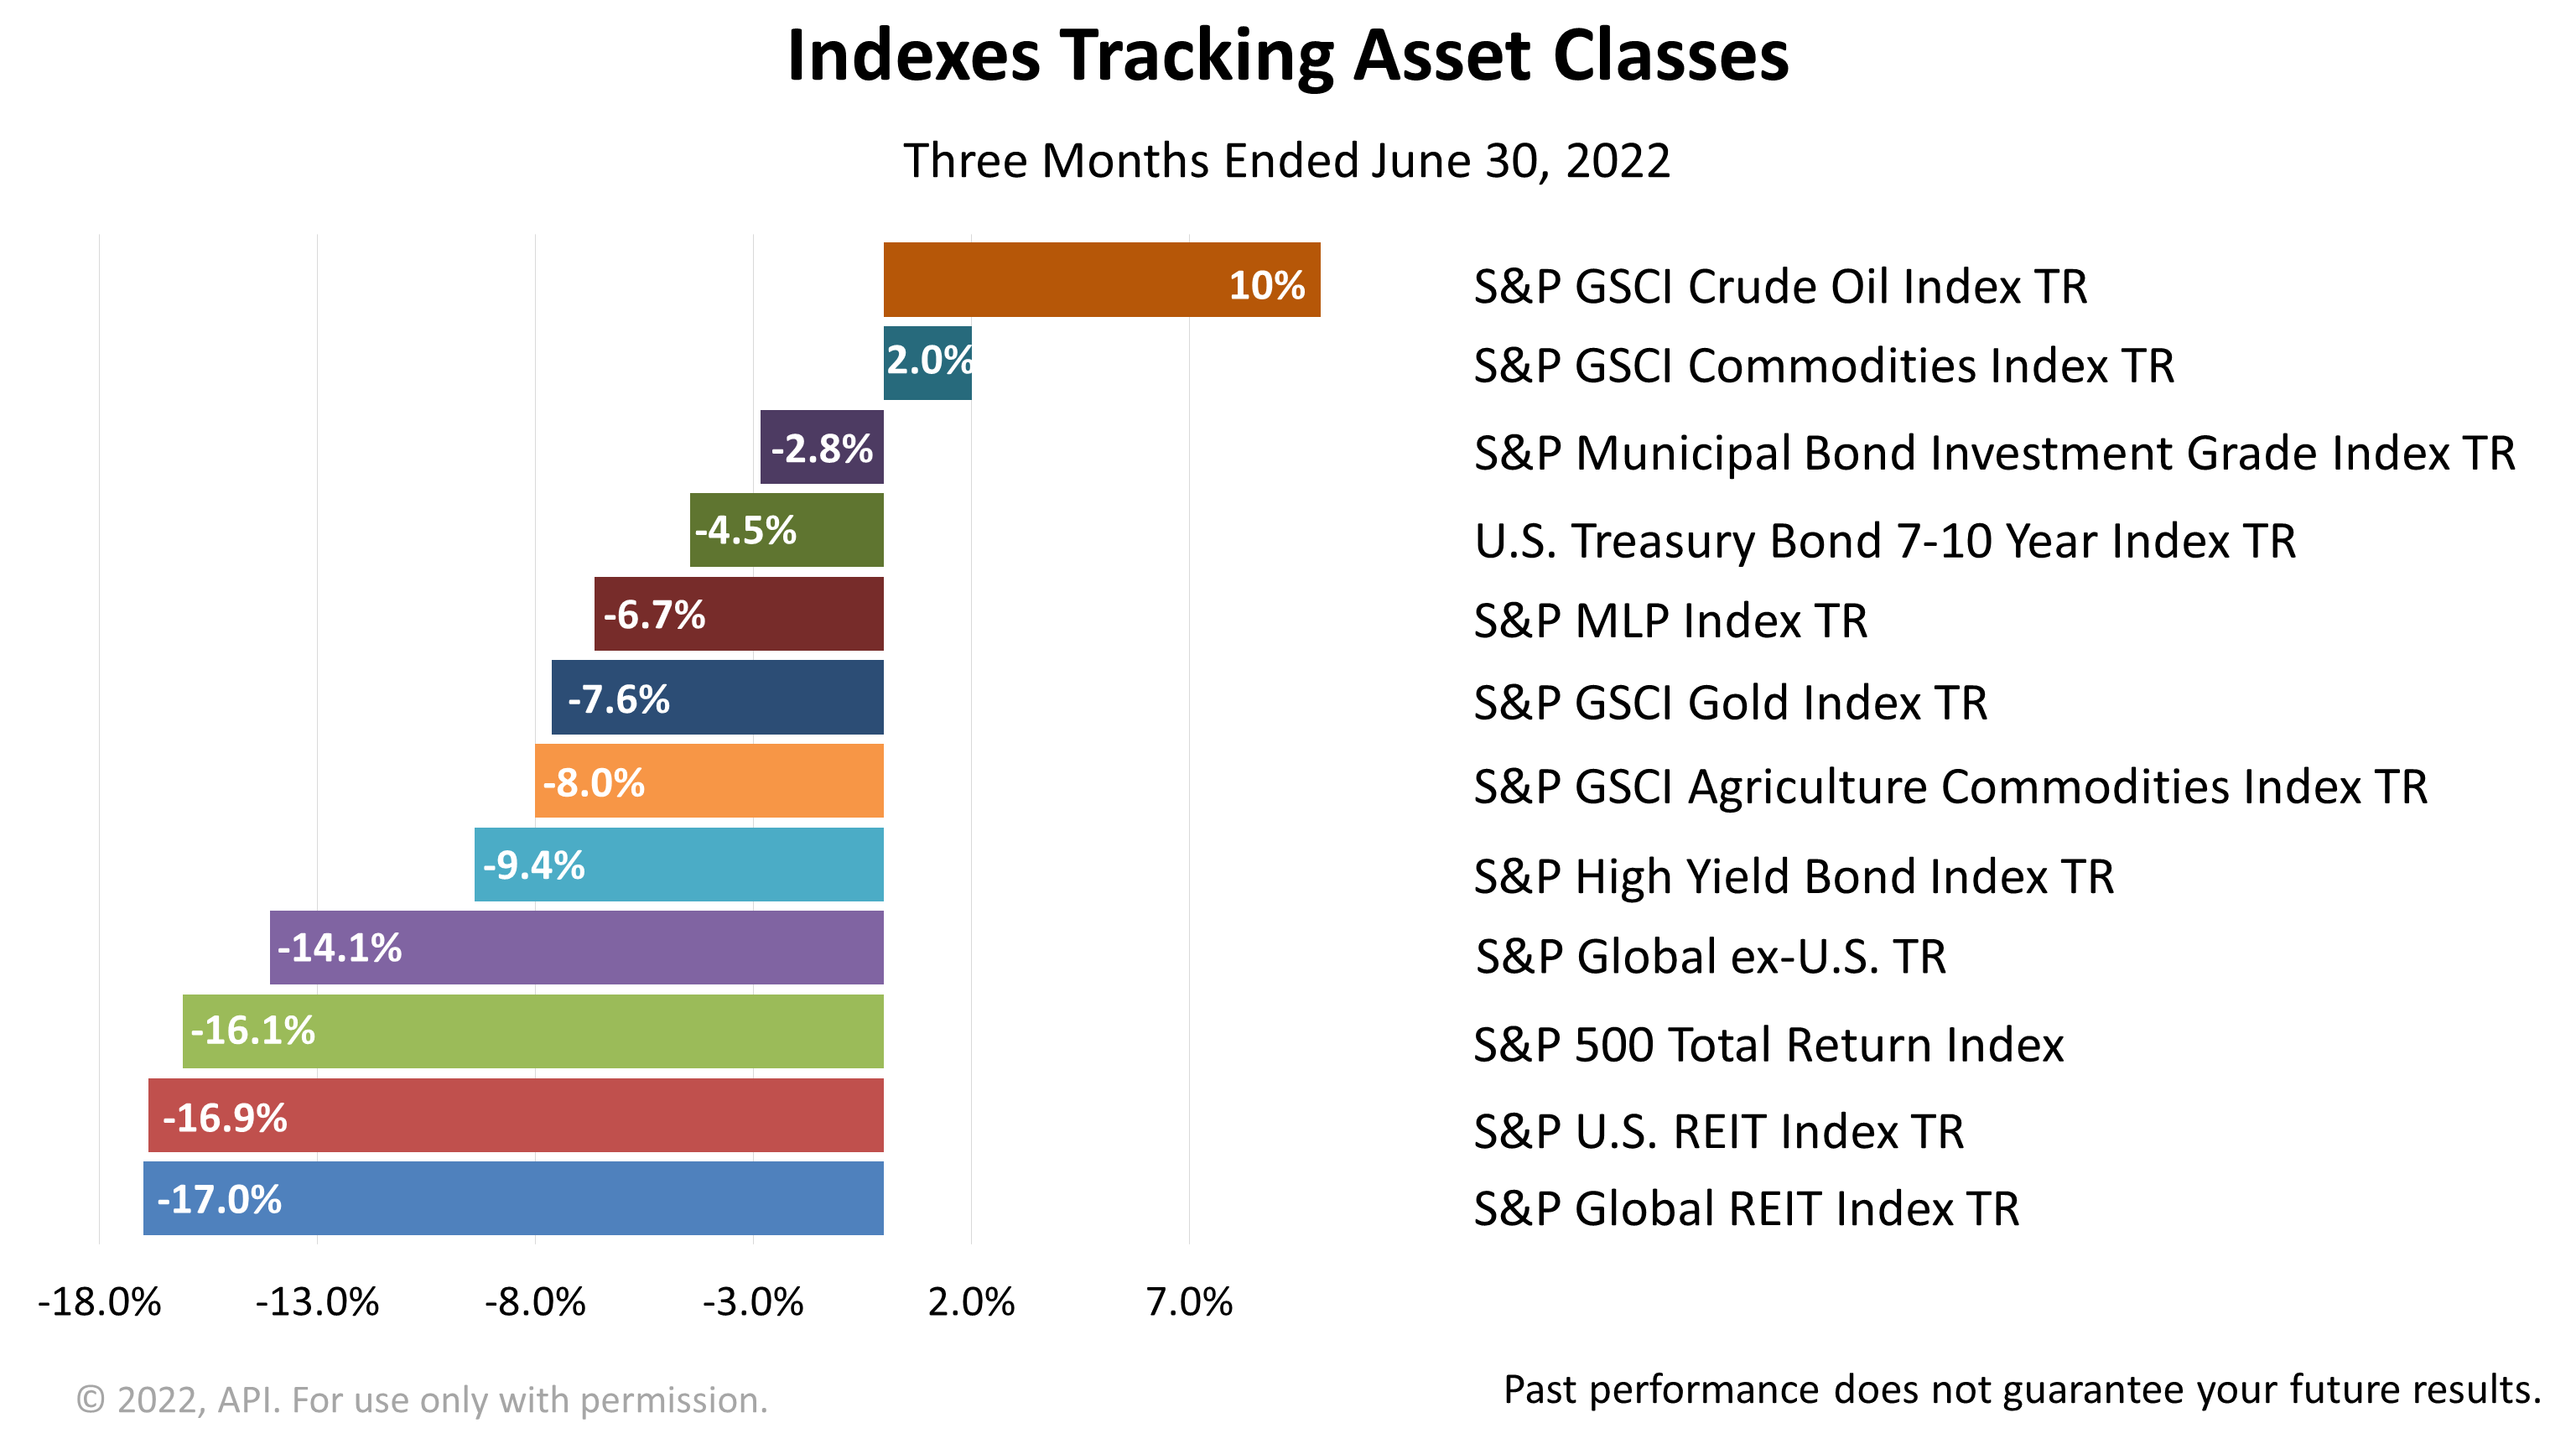
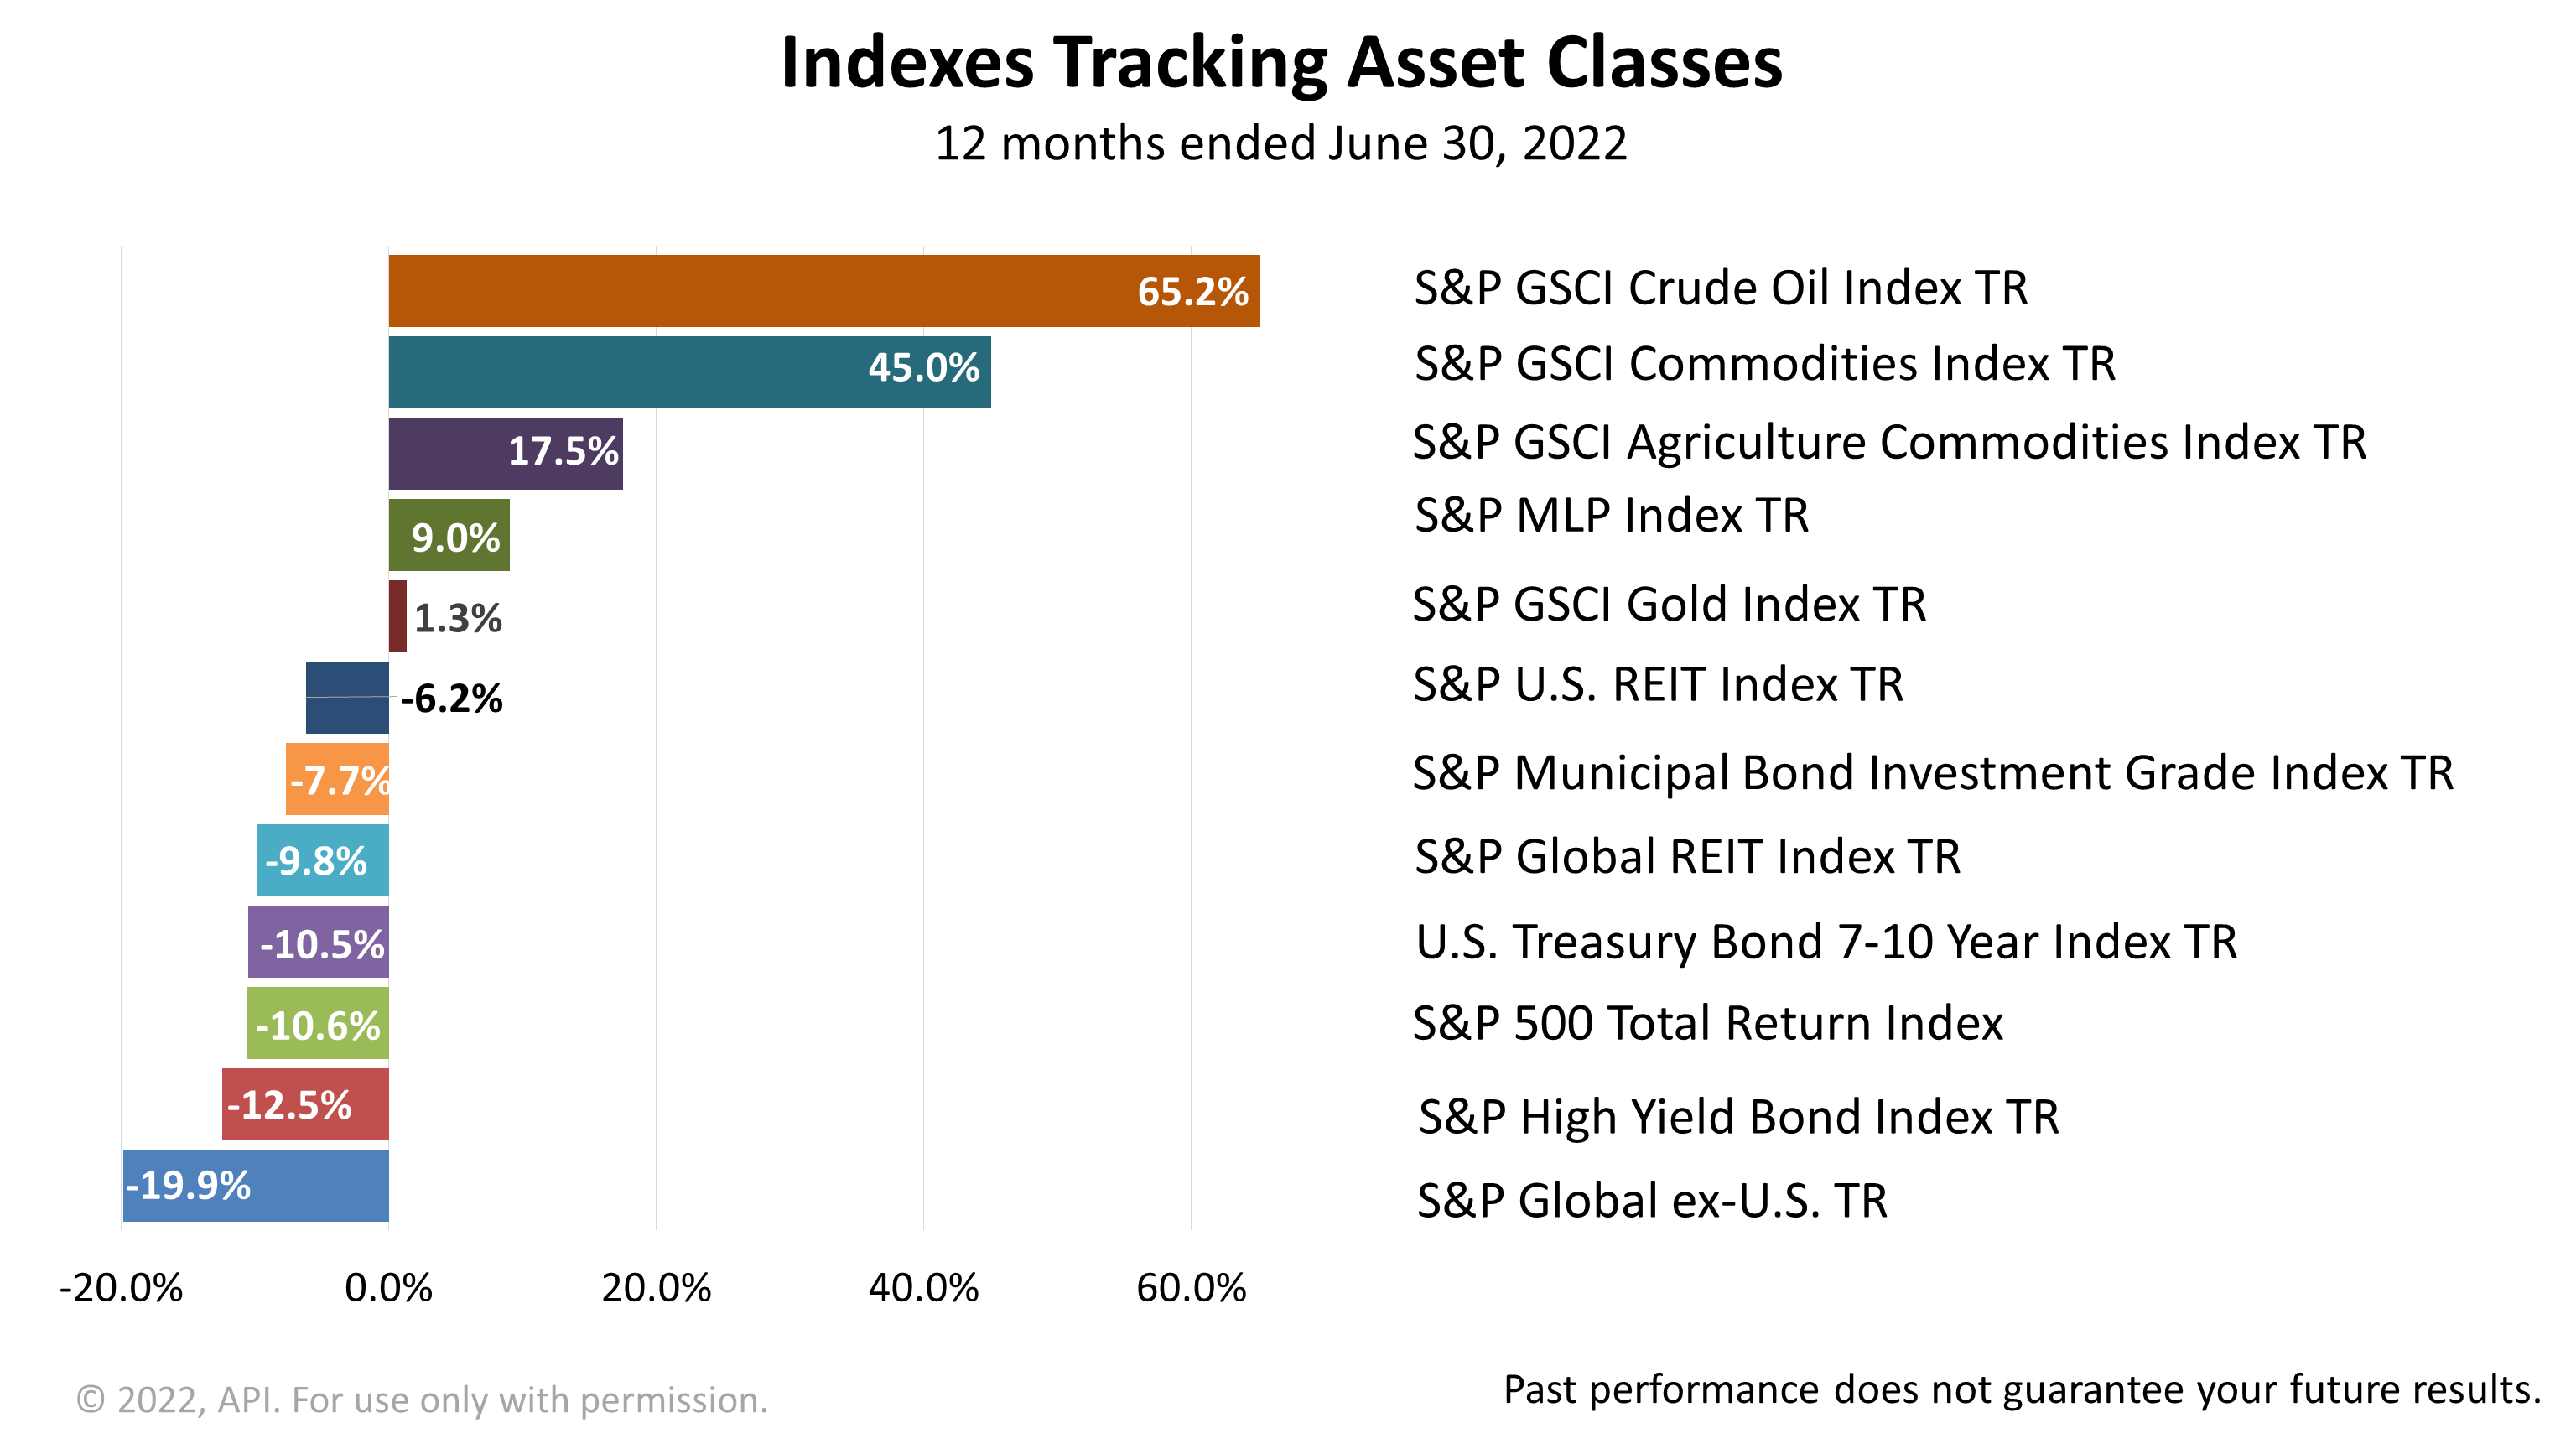
Energy stocks’ total return for the 12 months ended June 30, 2022, was an astonishing +65.2%.
As the economy recovered from the COVID pandemic slowdown and demand for oil increased, oil prices rose. And then the Ukraine invasion caused oil to spike higher than in a decade.
A similar pattern whipped prices for commodities and agriculture company shares, leading to their superlative performance.
Meanwhile, the worst of the diversified group of securities indexes representing 13 asset classes in the 12 months ended June 30, 2022, was a global stock benchmark that excludes U.S. stocks, which declined -19.9% versus a loss of -10.6% on U.S. stocks represented by the S&P 500.
Click image to enlarge
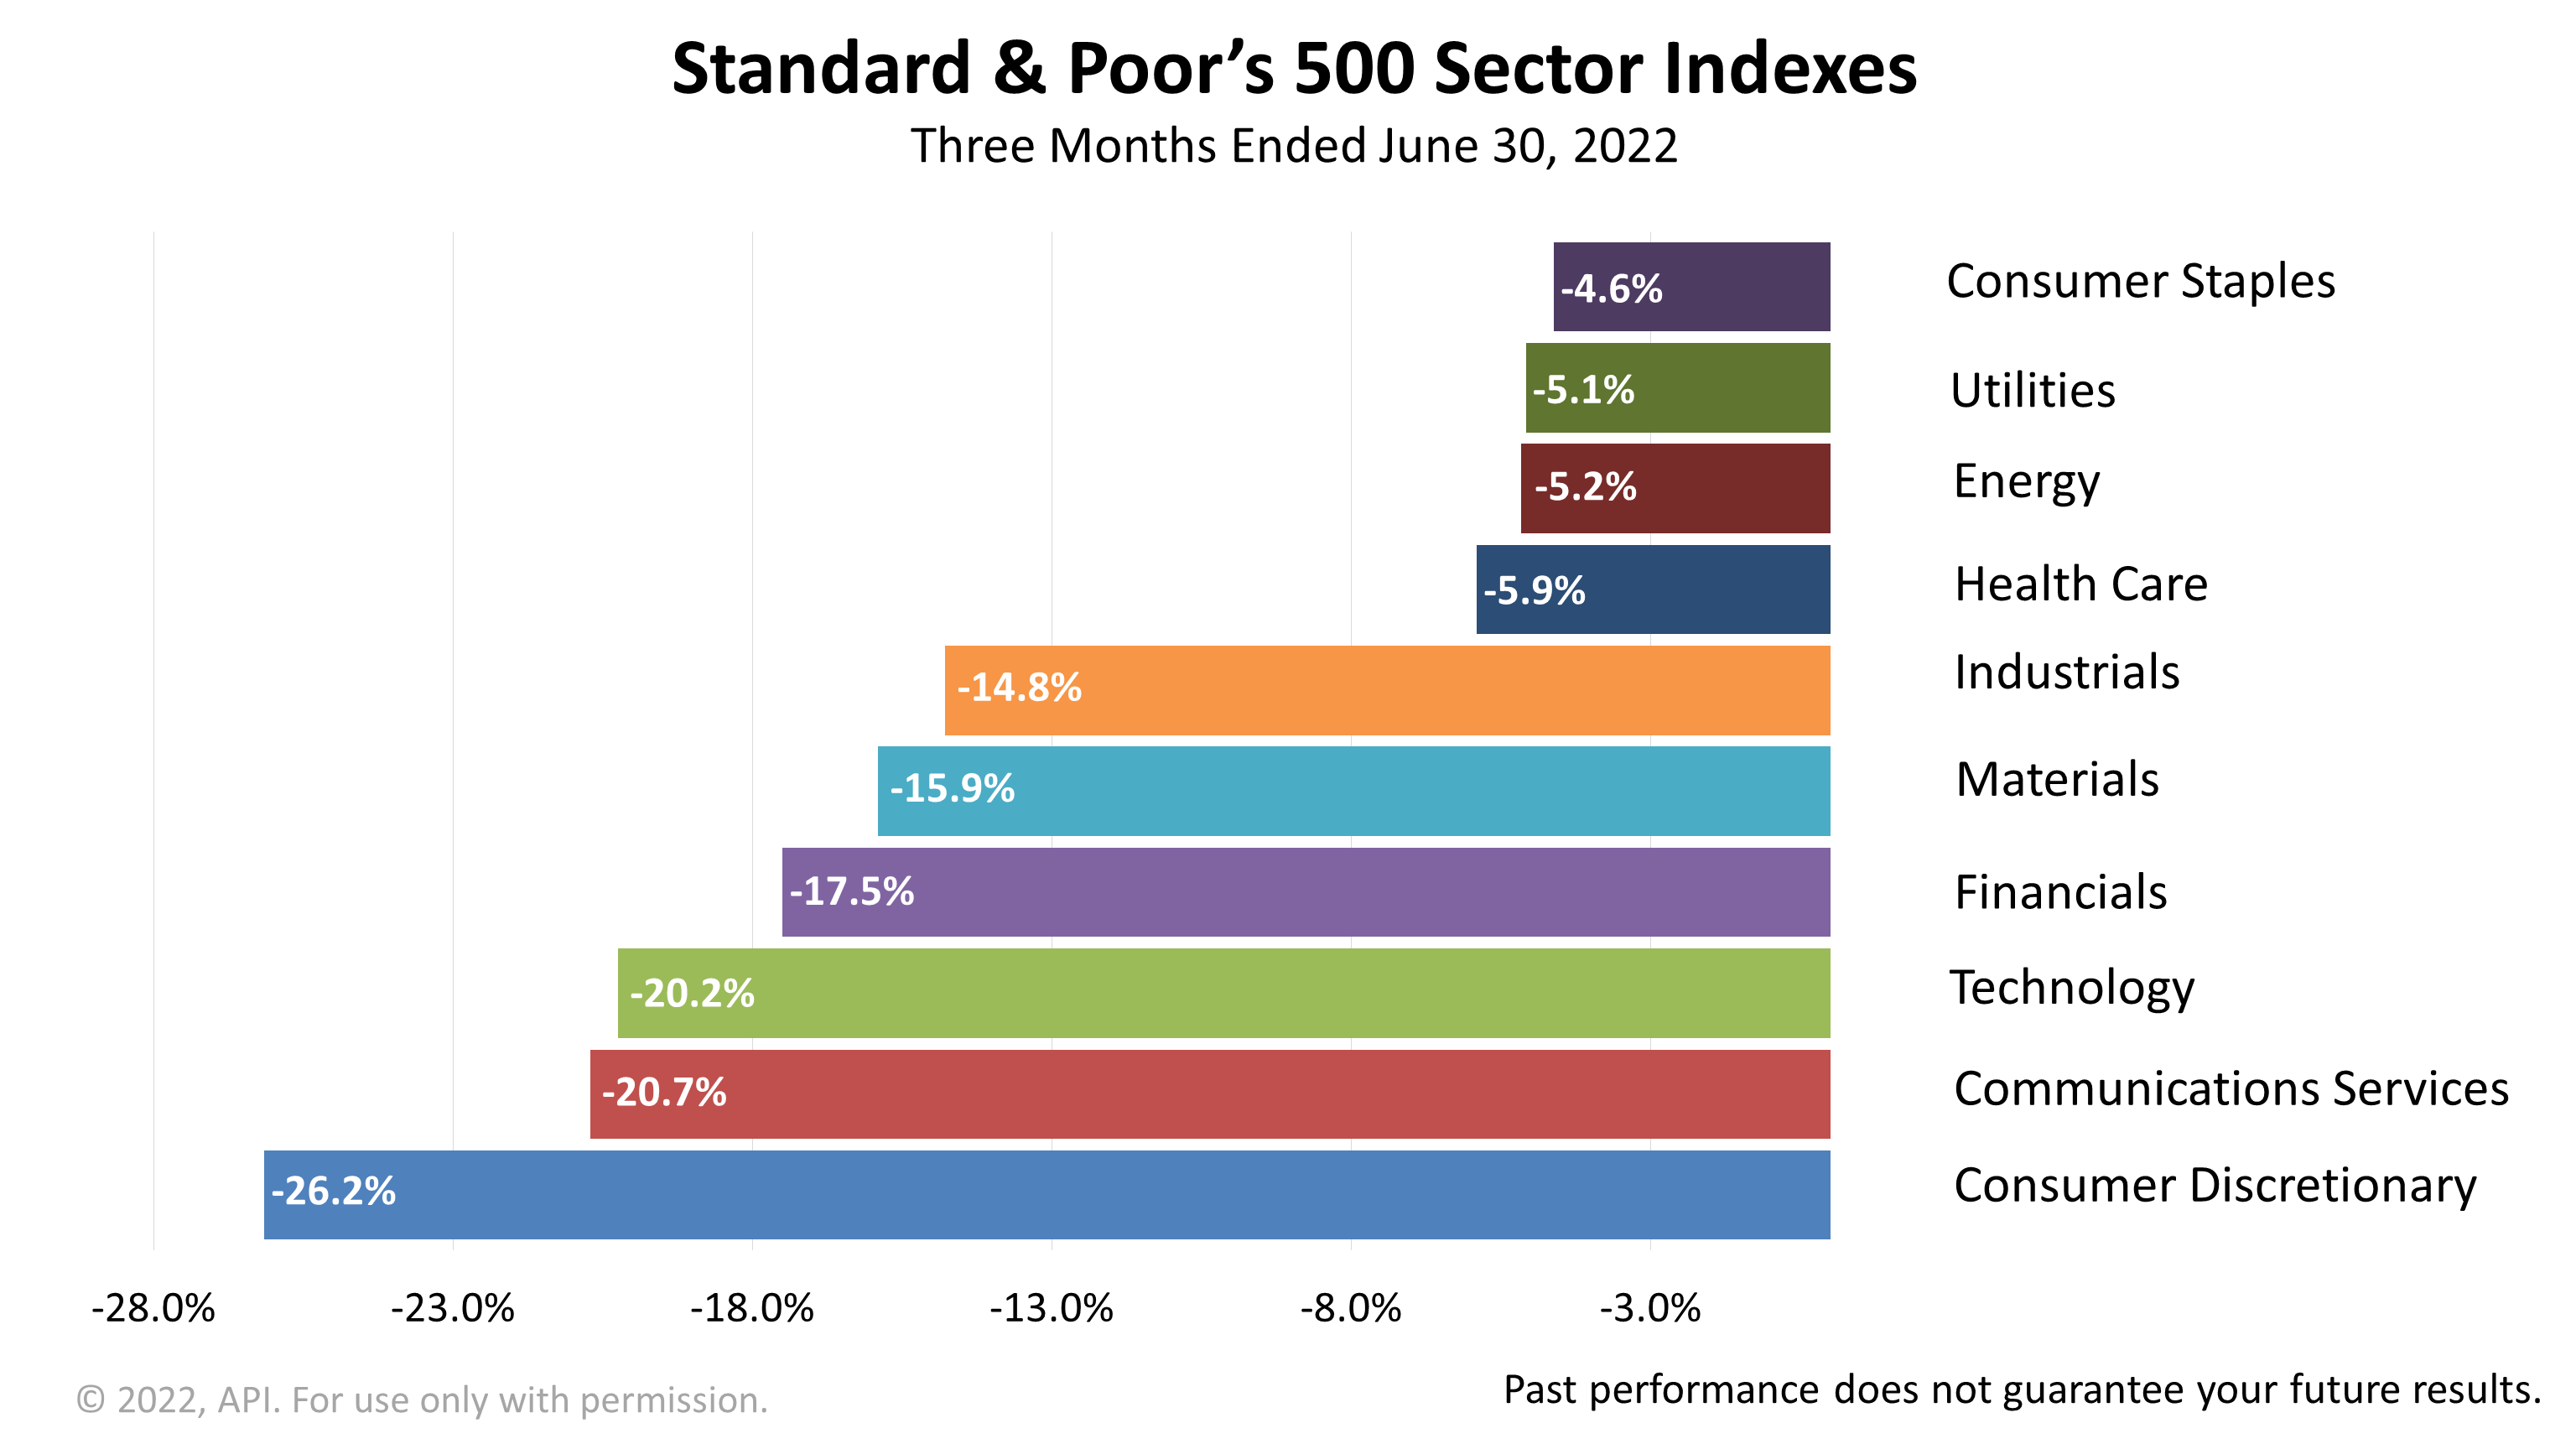
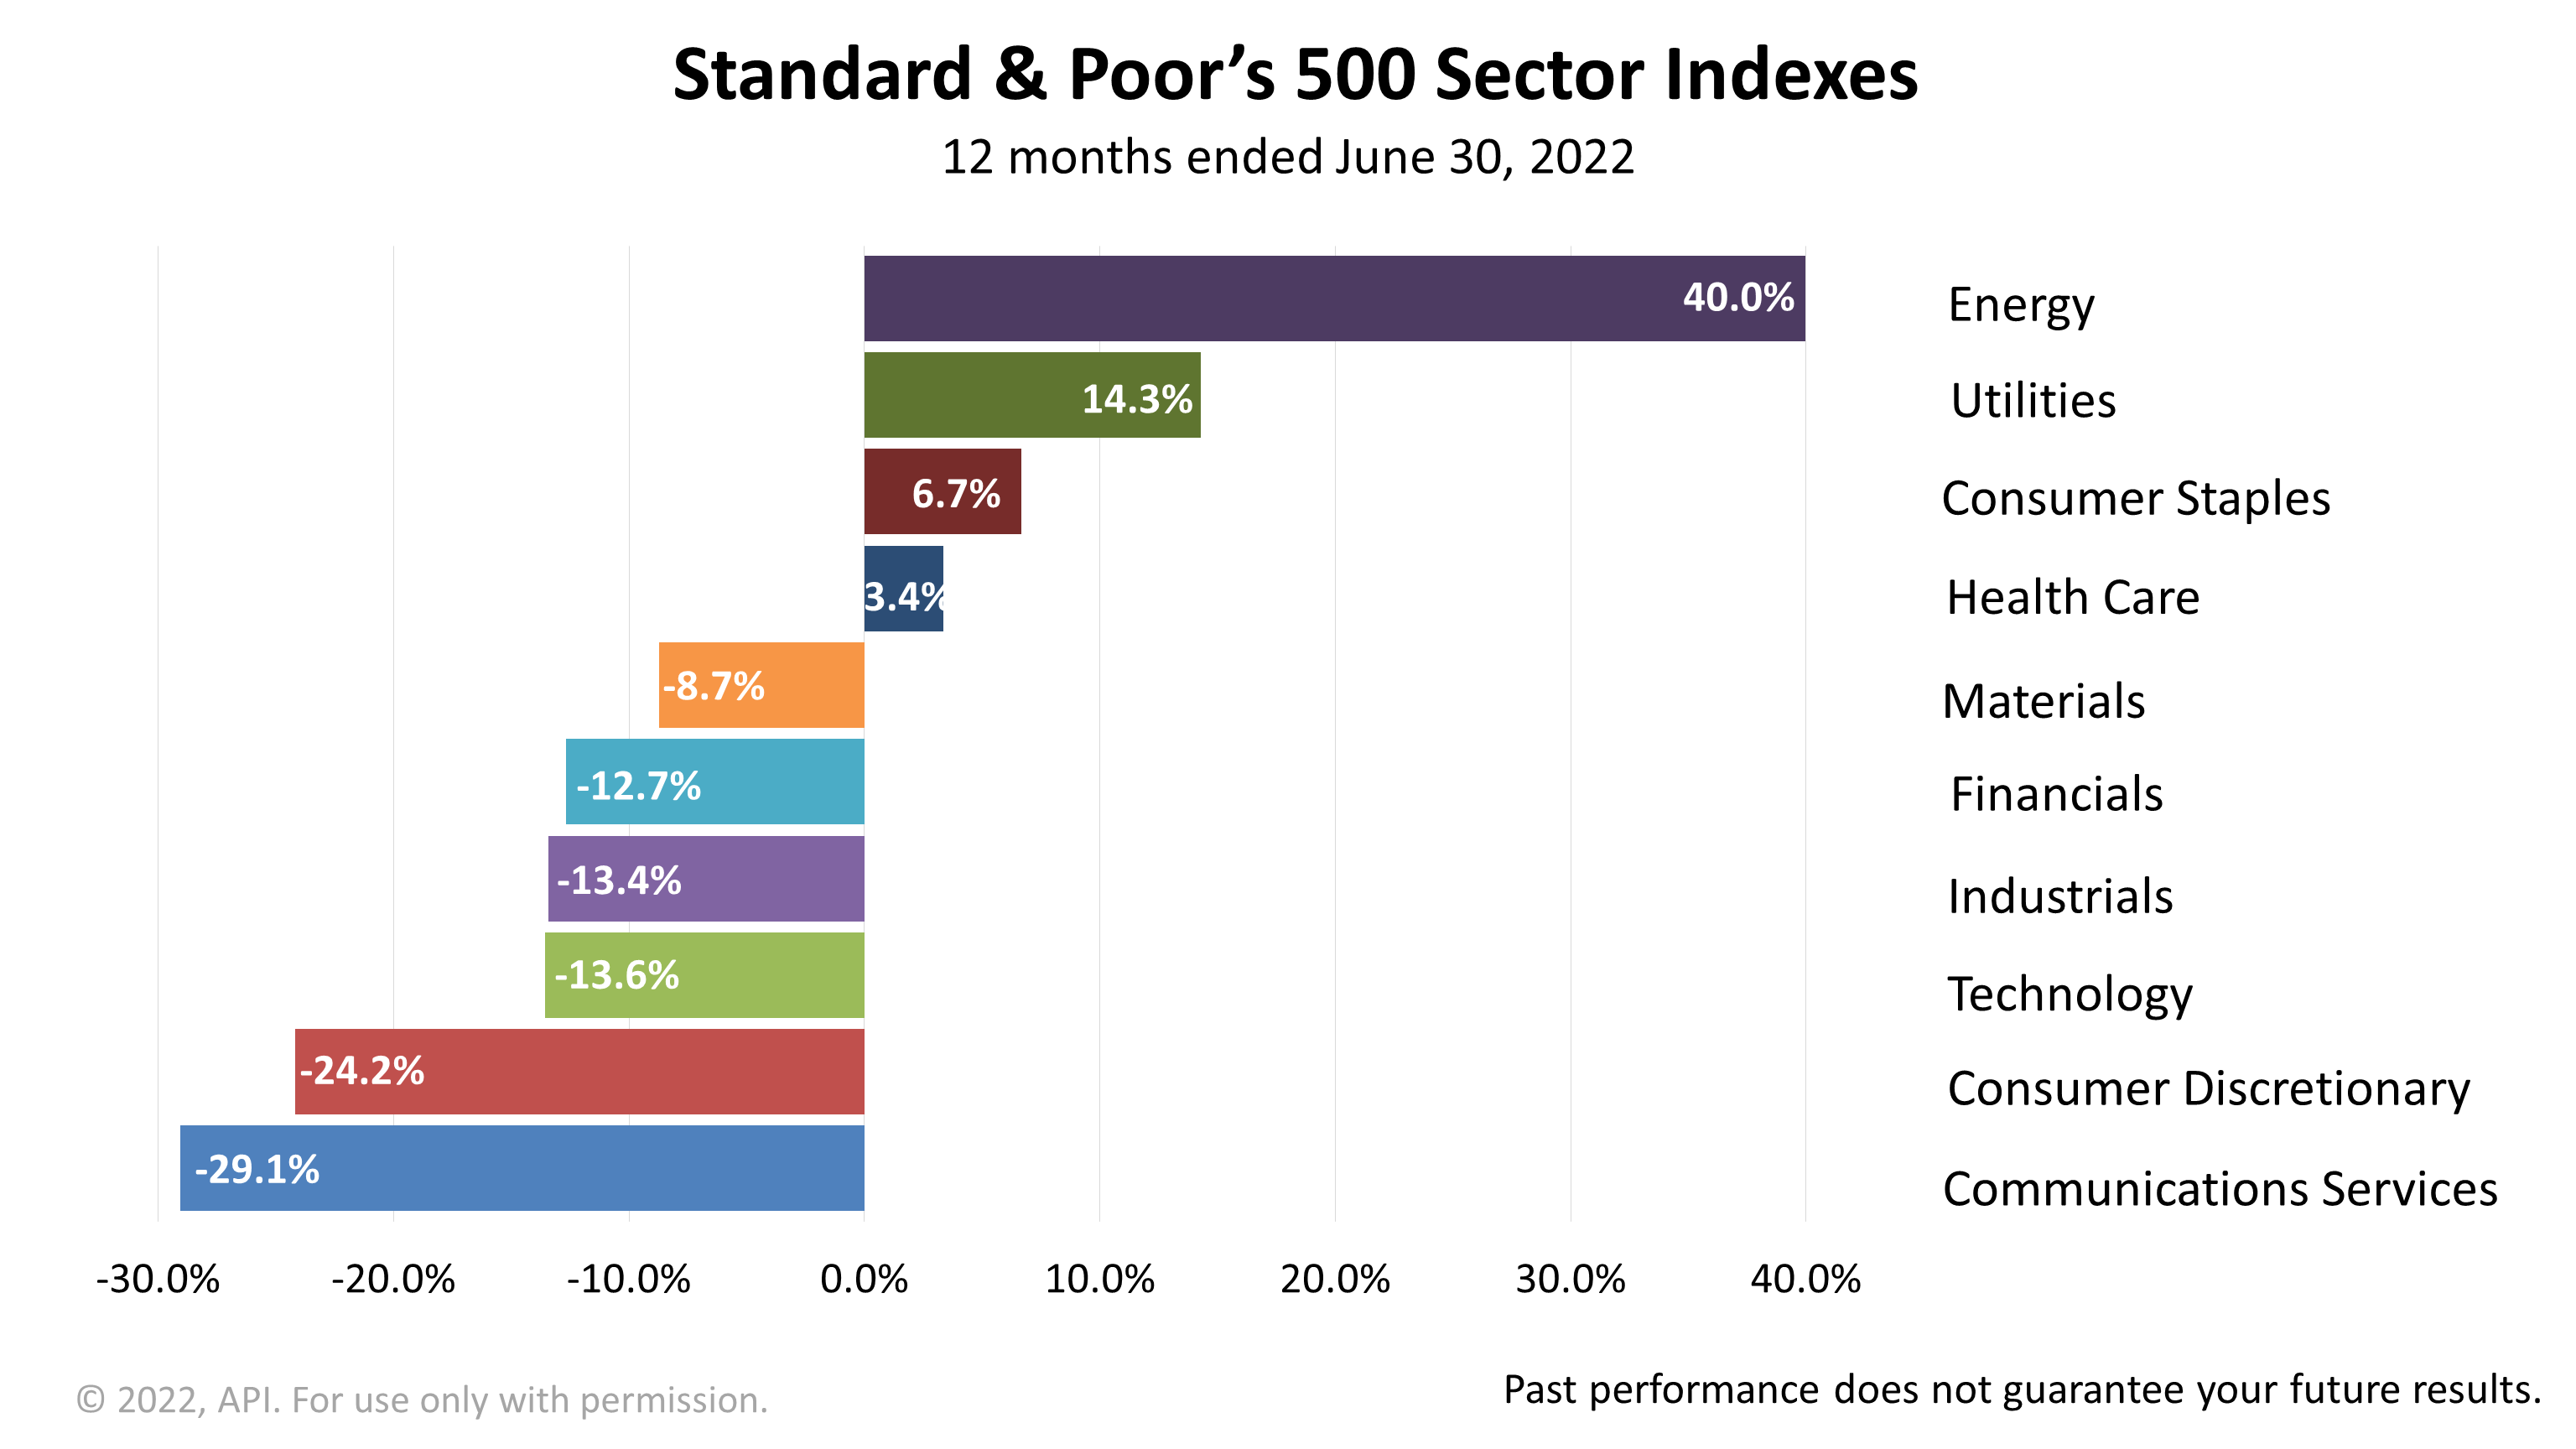
Higher energy prices brought energy companies to outperform the 10 industry sectors in the Standard & Poor’s 500 stock index.
Energy, one of 10 industry sectors in the S&P 500 stock index, was the No. 1 performing sector, with a +40% return in the 12 months through the end of June.
Was that predictable?
Click image to enlarge
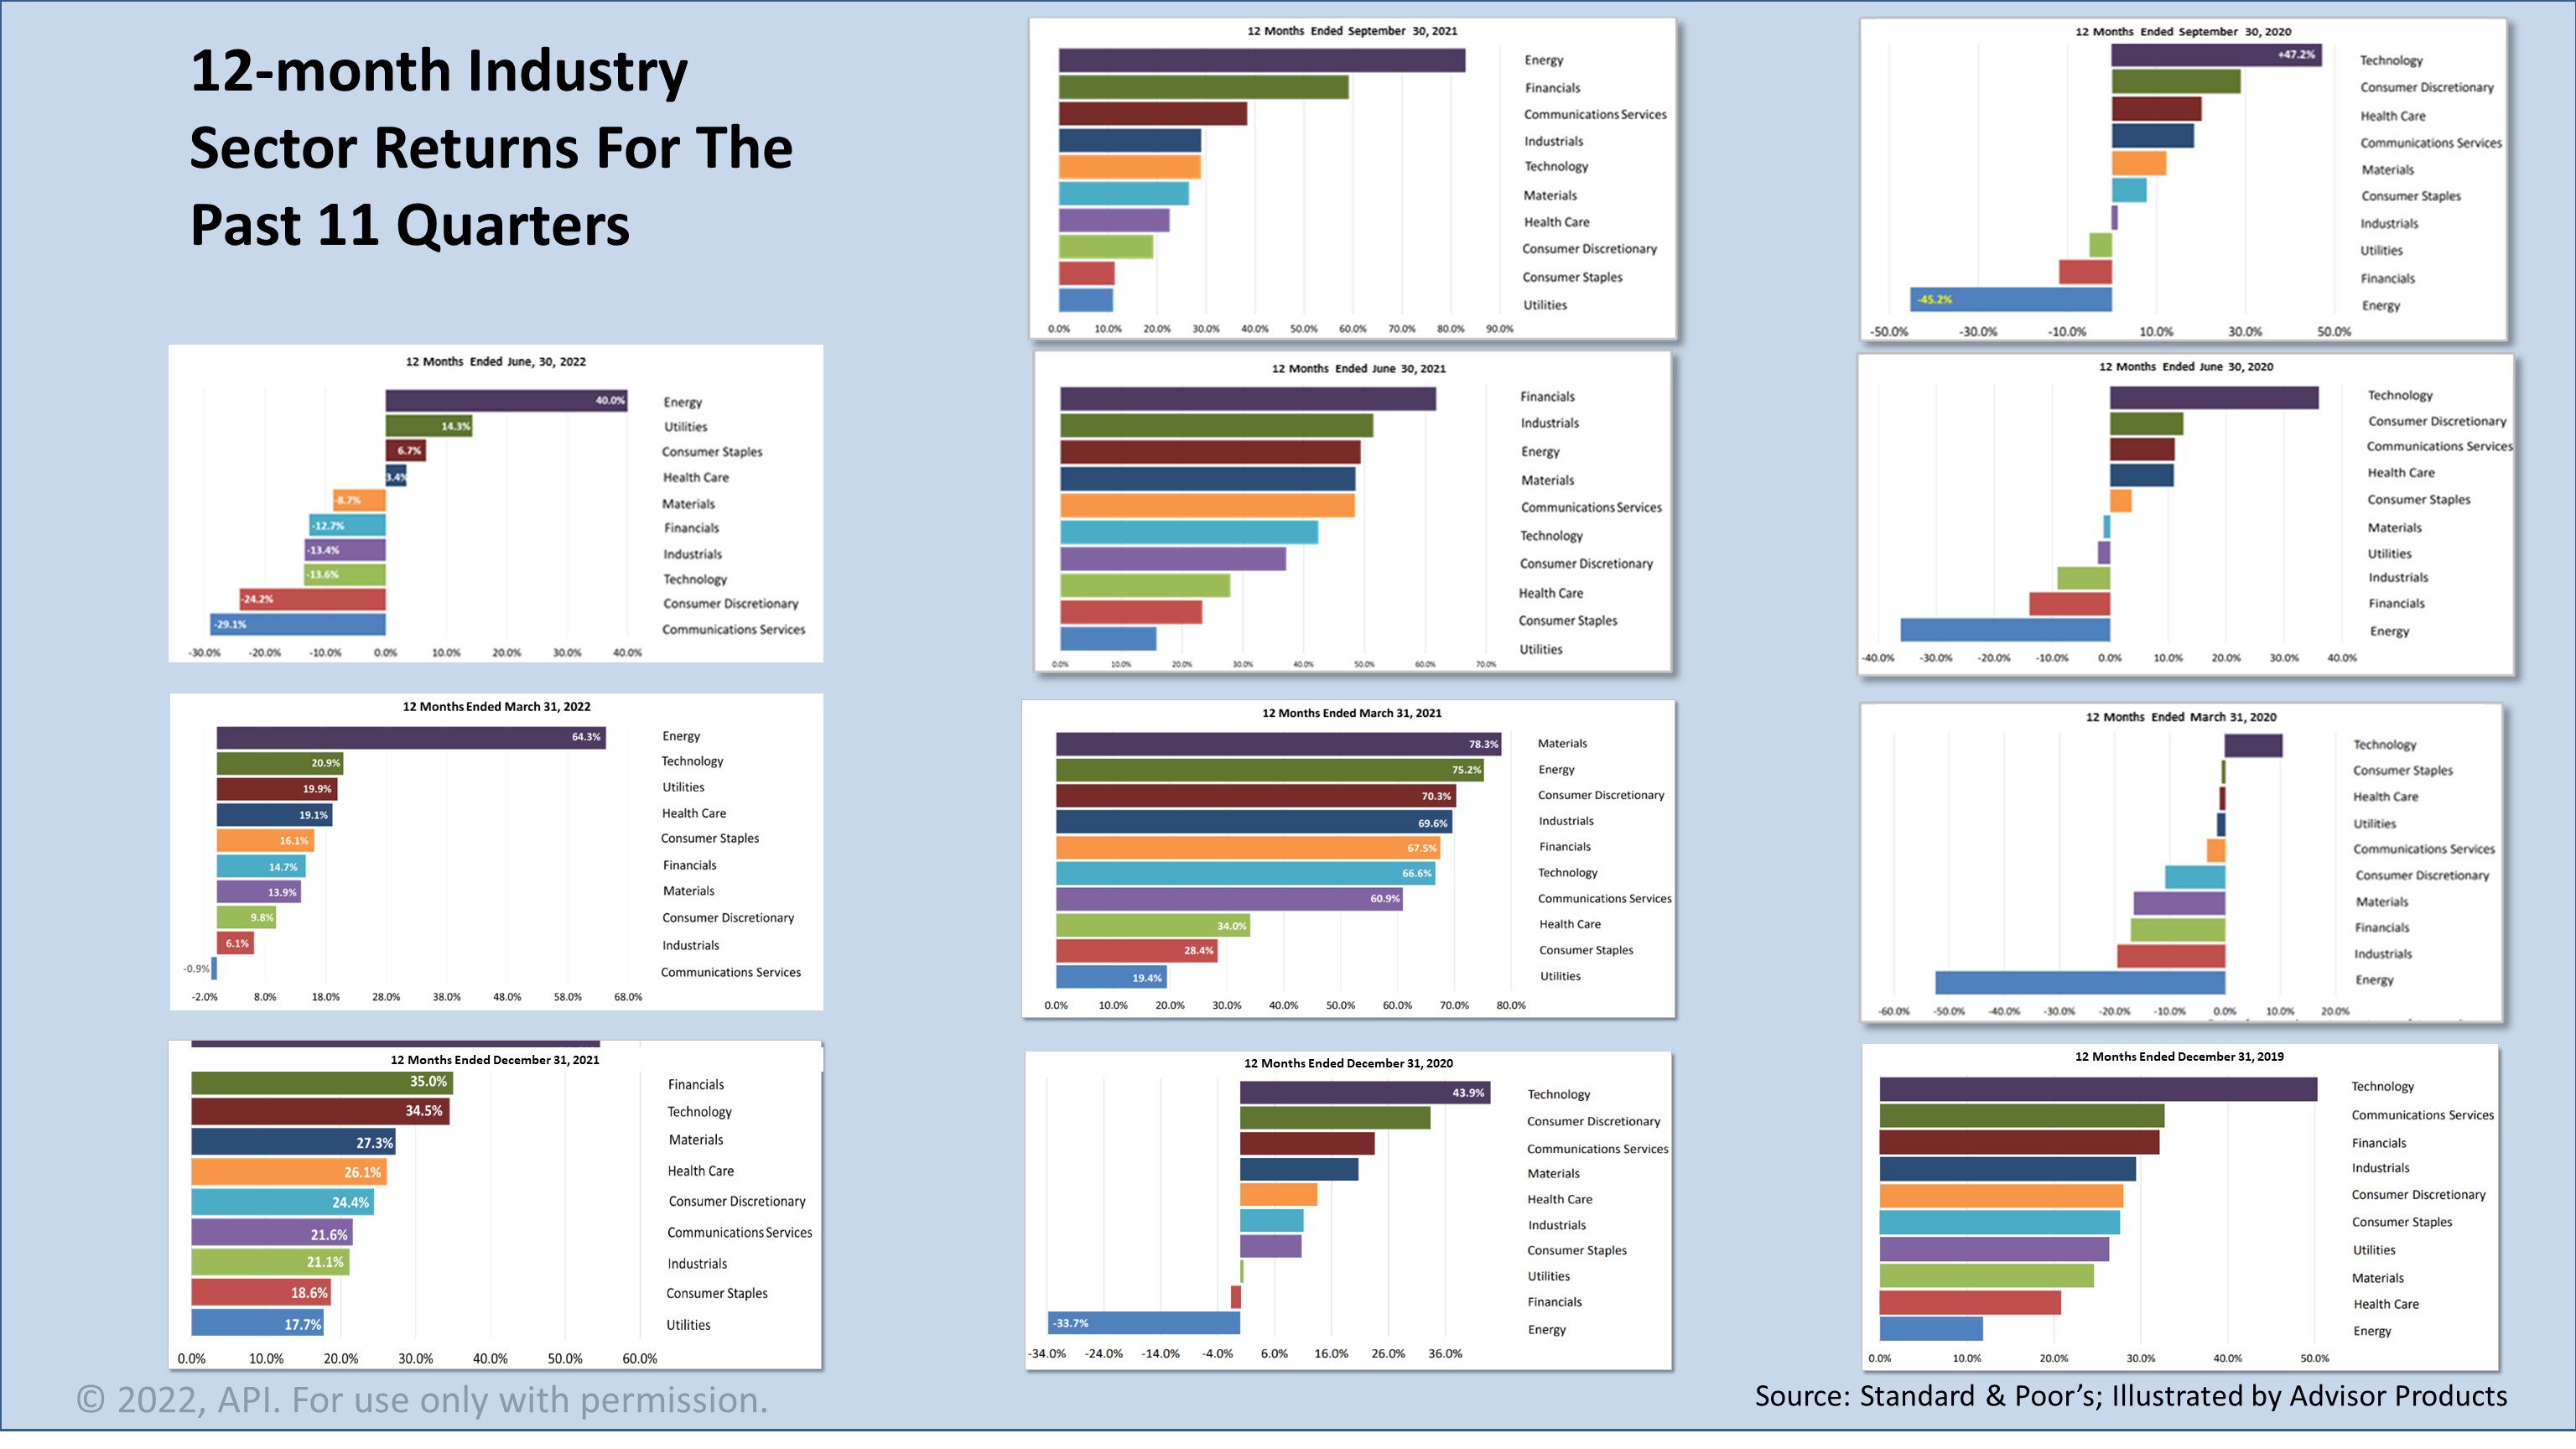
Here are 12-month industry sector returns for the 11 past quarters, shown here to illustrate why it is so difficult to predict markets.
That’s three and a half years—11 quarters.
Each snapshot shows 12-month returns on the 10 sectors.
The way to read this set of charts is by starting with the second quarter 2022, in the upper left, and reading down to see the previous quarter.
The 12-month returns are shown going back to the last quarter of 2019.
What stands out is that energy industry stocks have been the top-performing industry sector for the past four quarters but were the worst performers for five quarters in a row starting with the final quarter of 2019.
To capture the large gains on energy shares in the four quarters, you would have had to hold on to energy stocks through the dog days of 2020, when energy share prices plunged during the COVID-19 partial shutdown of the economy.
COVID was a 100-year risk and totally unexpected.
No one predicted it!
This is important evidence of how unpredictable the future of markets always is.
Going through this bit of history may help you stay focused on a strategic investment plan.
Instead of chasing dreams, please consider the strategy we use—modern portfolio theory—as a framework for portfolio management.

Click image to enlarge
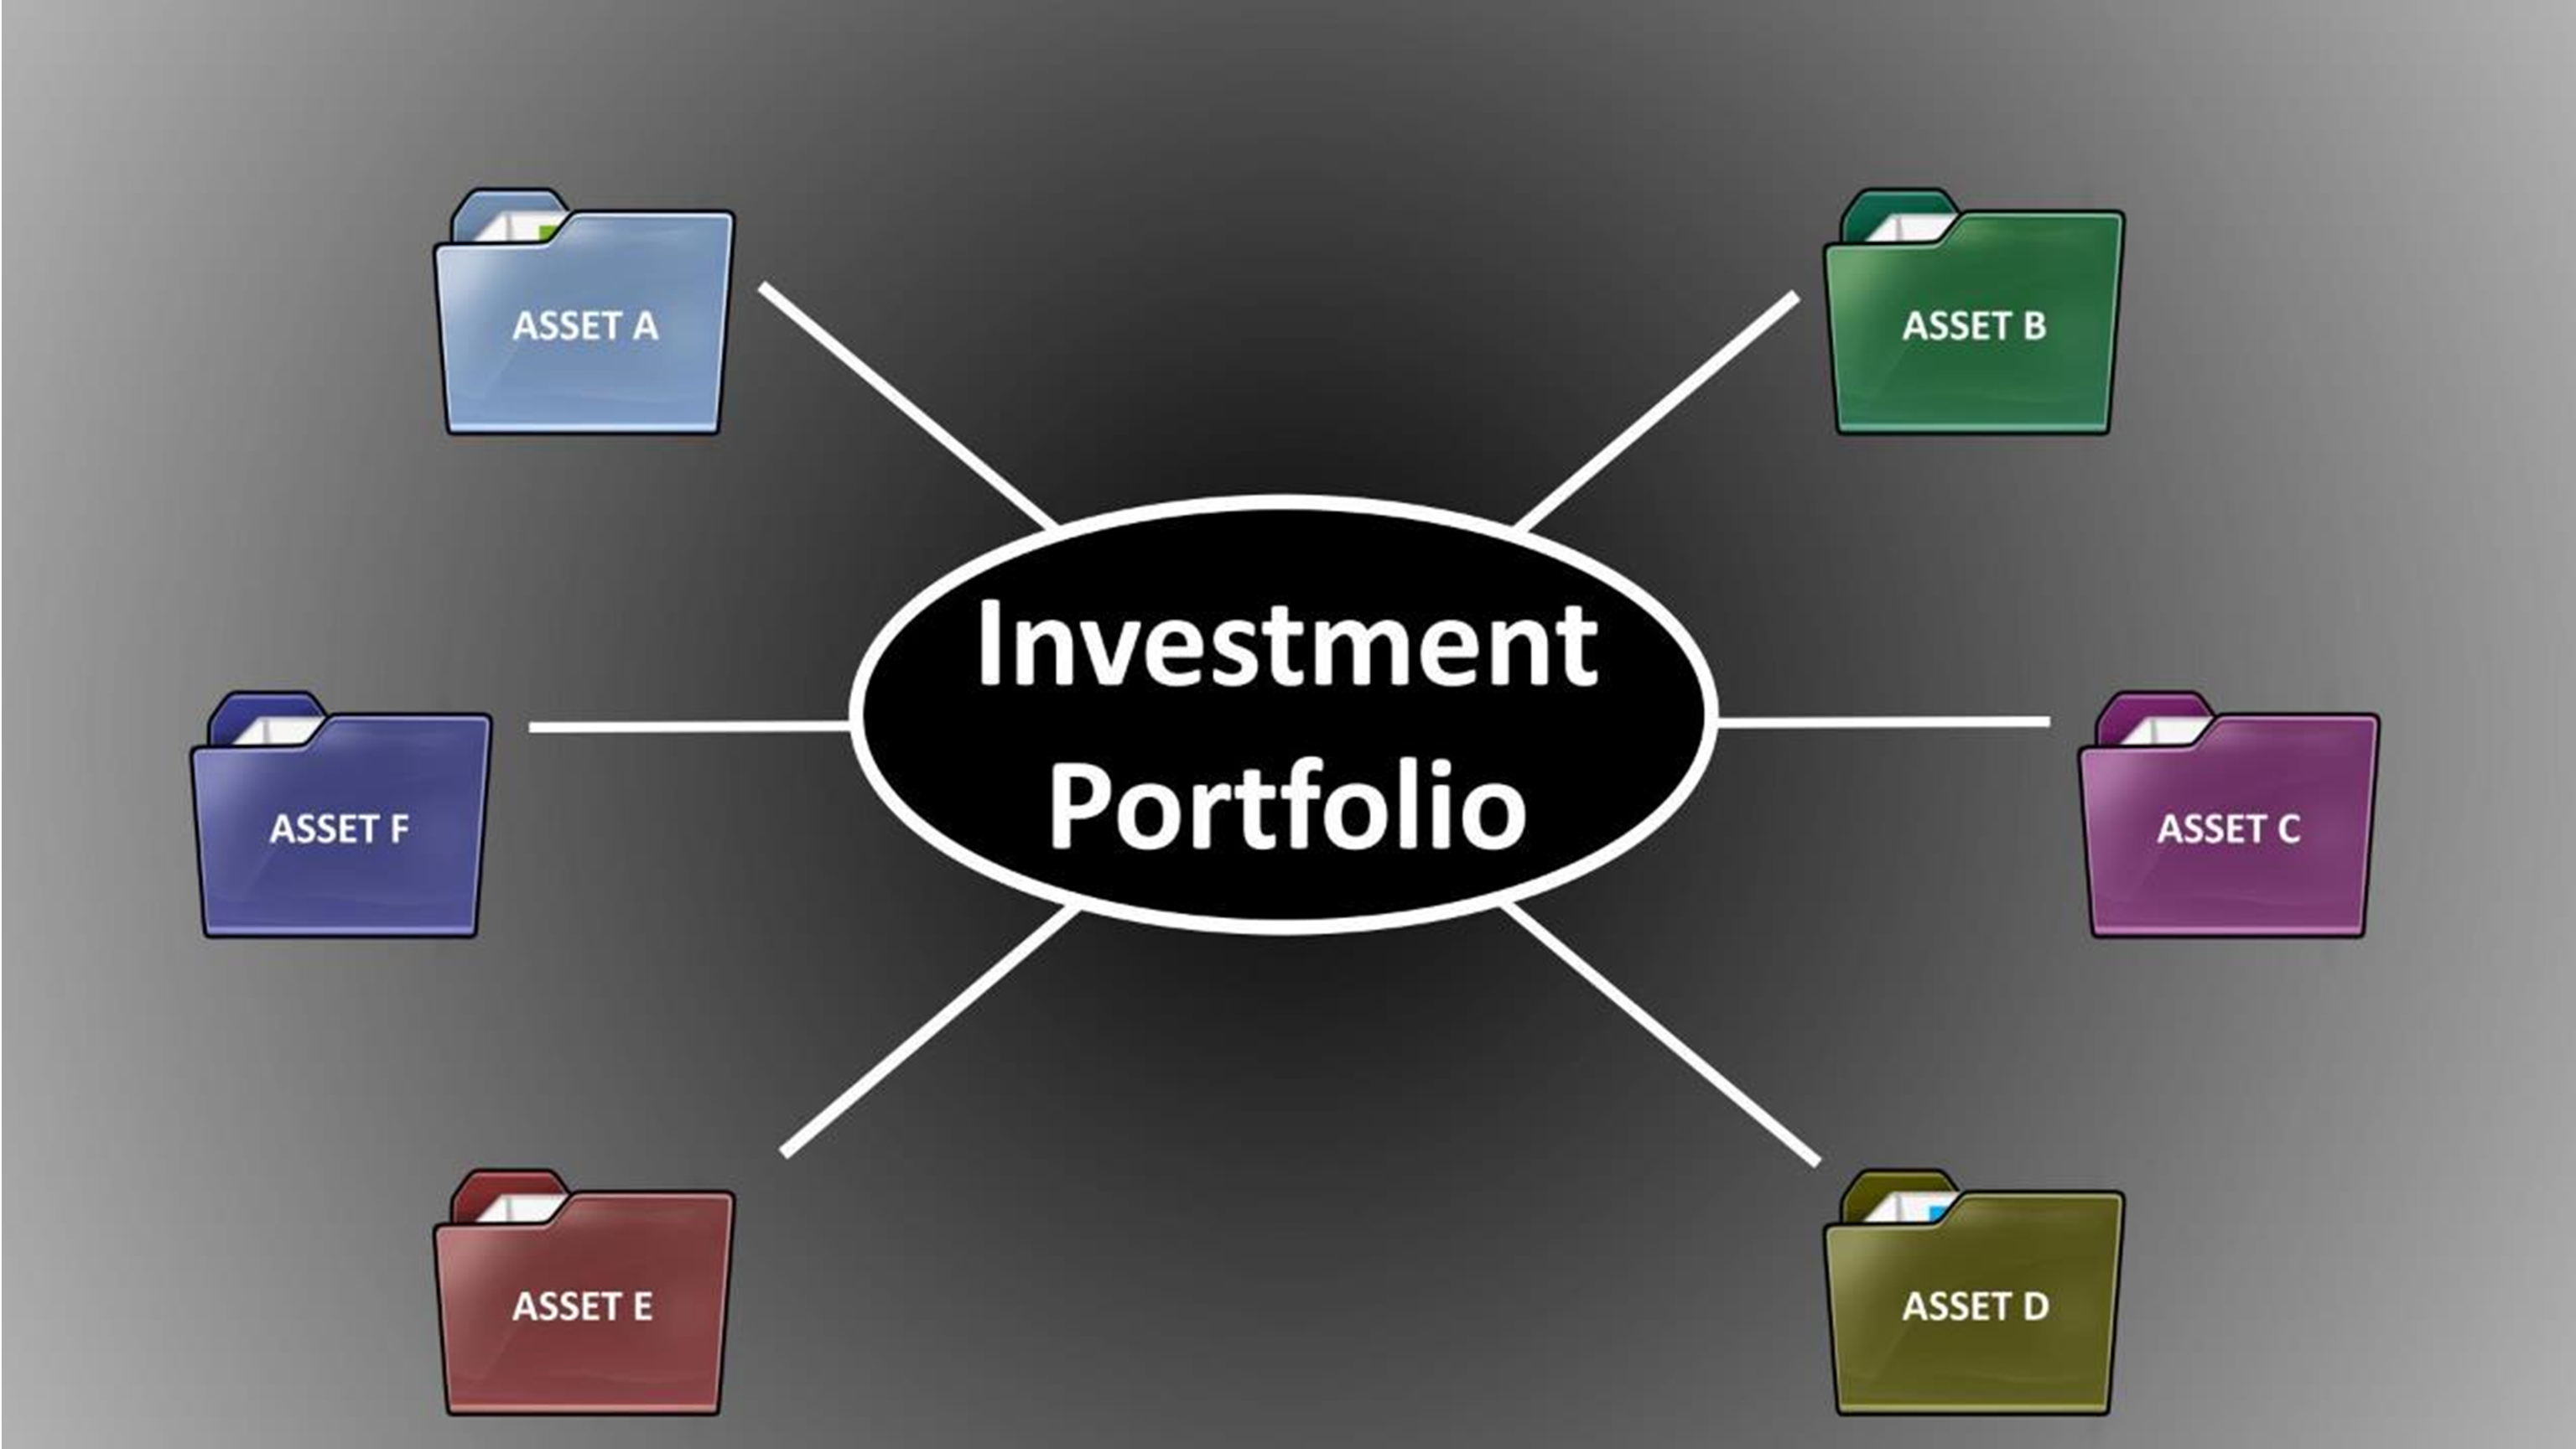
Modern portfolio theory, or MPT, is a framework for investing.
Just as constructing the framework for a home is strategically designed by connecting one piece of wood with another, MPT provides a system for constructing a portfolio based on measurable dimensions of investments—history and quantitative characteristics.
Owning different kinds of investments is less risky than owning only one type of asset, and MPT is a system for diversifying across a wide range of assets based on their statistical characteristics.
Click image to enlarge
Classifying investments based on their distinct characteristics—such as the aggregate value of a company’s shares outstanding, profit growth, and share-price variance—imposes a quantitative discipline for selecting combinations of investments based on historical data.
Investments revolve around a world that is always changing, and not enough statistical history of different kinds of investments exists to make investment predictions about the future with certainty.
MPT is a way of managing that uncertainty.

Click image to enlarge
Just as every stud or joist in a home has its own mathematical dimensions, investments have their own unique shapes and characteristics.
MPT organizes statistics that measure the characteristics of different kinds of investments to construct a portfolio.
MPT is a way of building a portfolio of investments so that the return you can expect over the long run is maximized for a given level of risk.
Just as a home can be built to your personal needs and preferences, so, too, can a portfolio be custom built to suit your personal risk tolerance specifications.
To be clear, cookie-cutter portfolios are not what we do. Each portfolio can be tailored to an investor’s preferences.

Click image to enlarge
Economist Harry Markowitz introduced MPT in a 1952 essay.
He was awarded a Nobel Memorial Prize in Economic Sciences in 1990.
It’s worth noting that it took from 1952 to 1990, 38 years, for Markowitz to be recognized by the Nobel committee.
This provides insight into how long it takes for knowledge to be accepted.
Over the last 70 years, the power of modern portfolio theory has grown to be understood.
It is now the framework for investing embraced by institutional investors worldwide, and it is a foundational element in the curricula of the world’s best colleges and universities.
MPT does not guarantee investment success—nothing does—but MPT is embraced by pension funds and other institutional investors, and it is the intellectual underpinning for the performance numbers we’ll share with you in this report.

Click image to enlarge
MPT is a starting point for constructing a quantitatively driven portfolio based on fundamental economics.
MPT enables a financial professional with an understanding of the math to adjust what’s happened in the past to devise an investment plan based on economic fundamentals.
Just as the laws of physics are relied upon for building a home, fundamental factors of economics are relied upon in constructing a portfolio.
For example, we know that 70% of the American economy is accounted for by consumer spending.
To measure strength in the economy, monthly data published by the U.S. government—such as the savings rate, compensation of employees, personal income, and inflation—provide decades of data about trends.
The growth of the economy drives investment returns.

Click image to enlarge
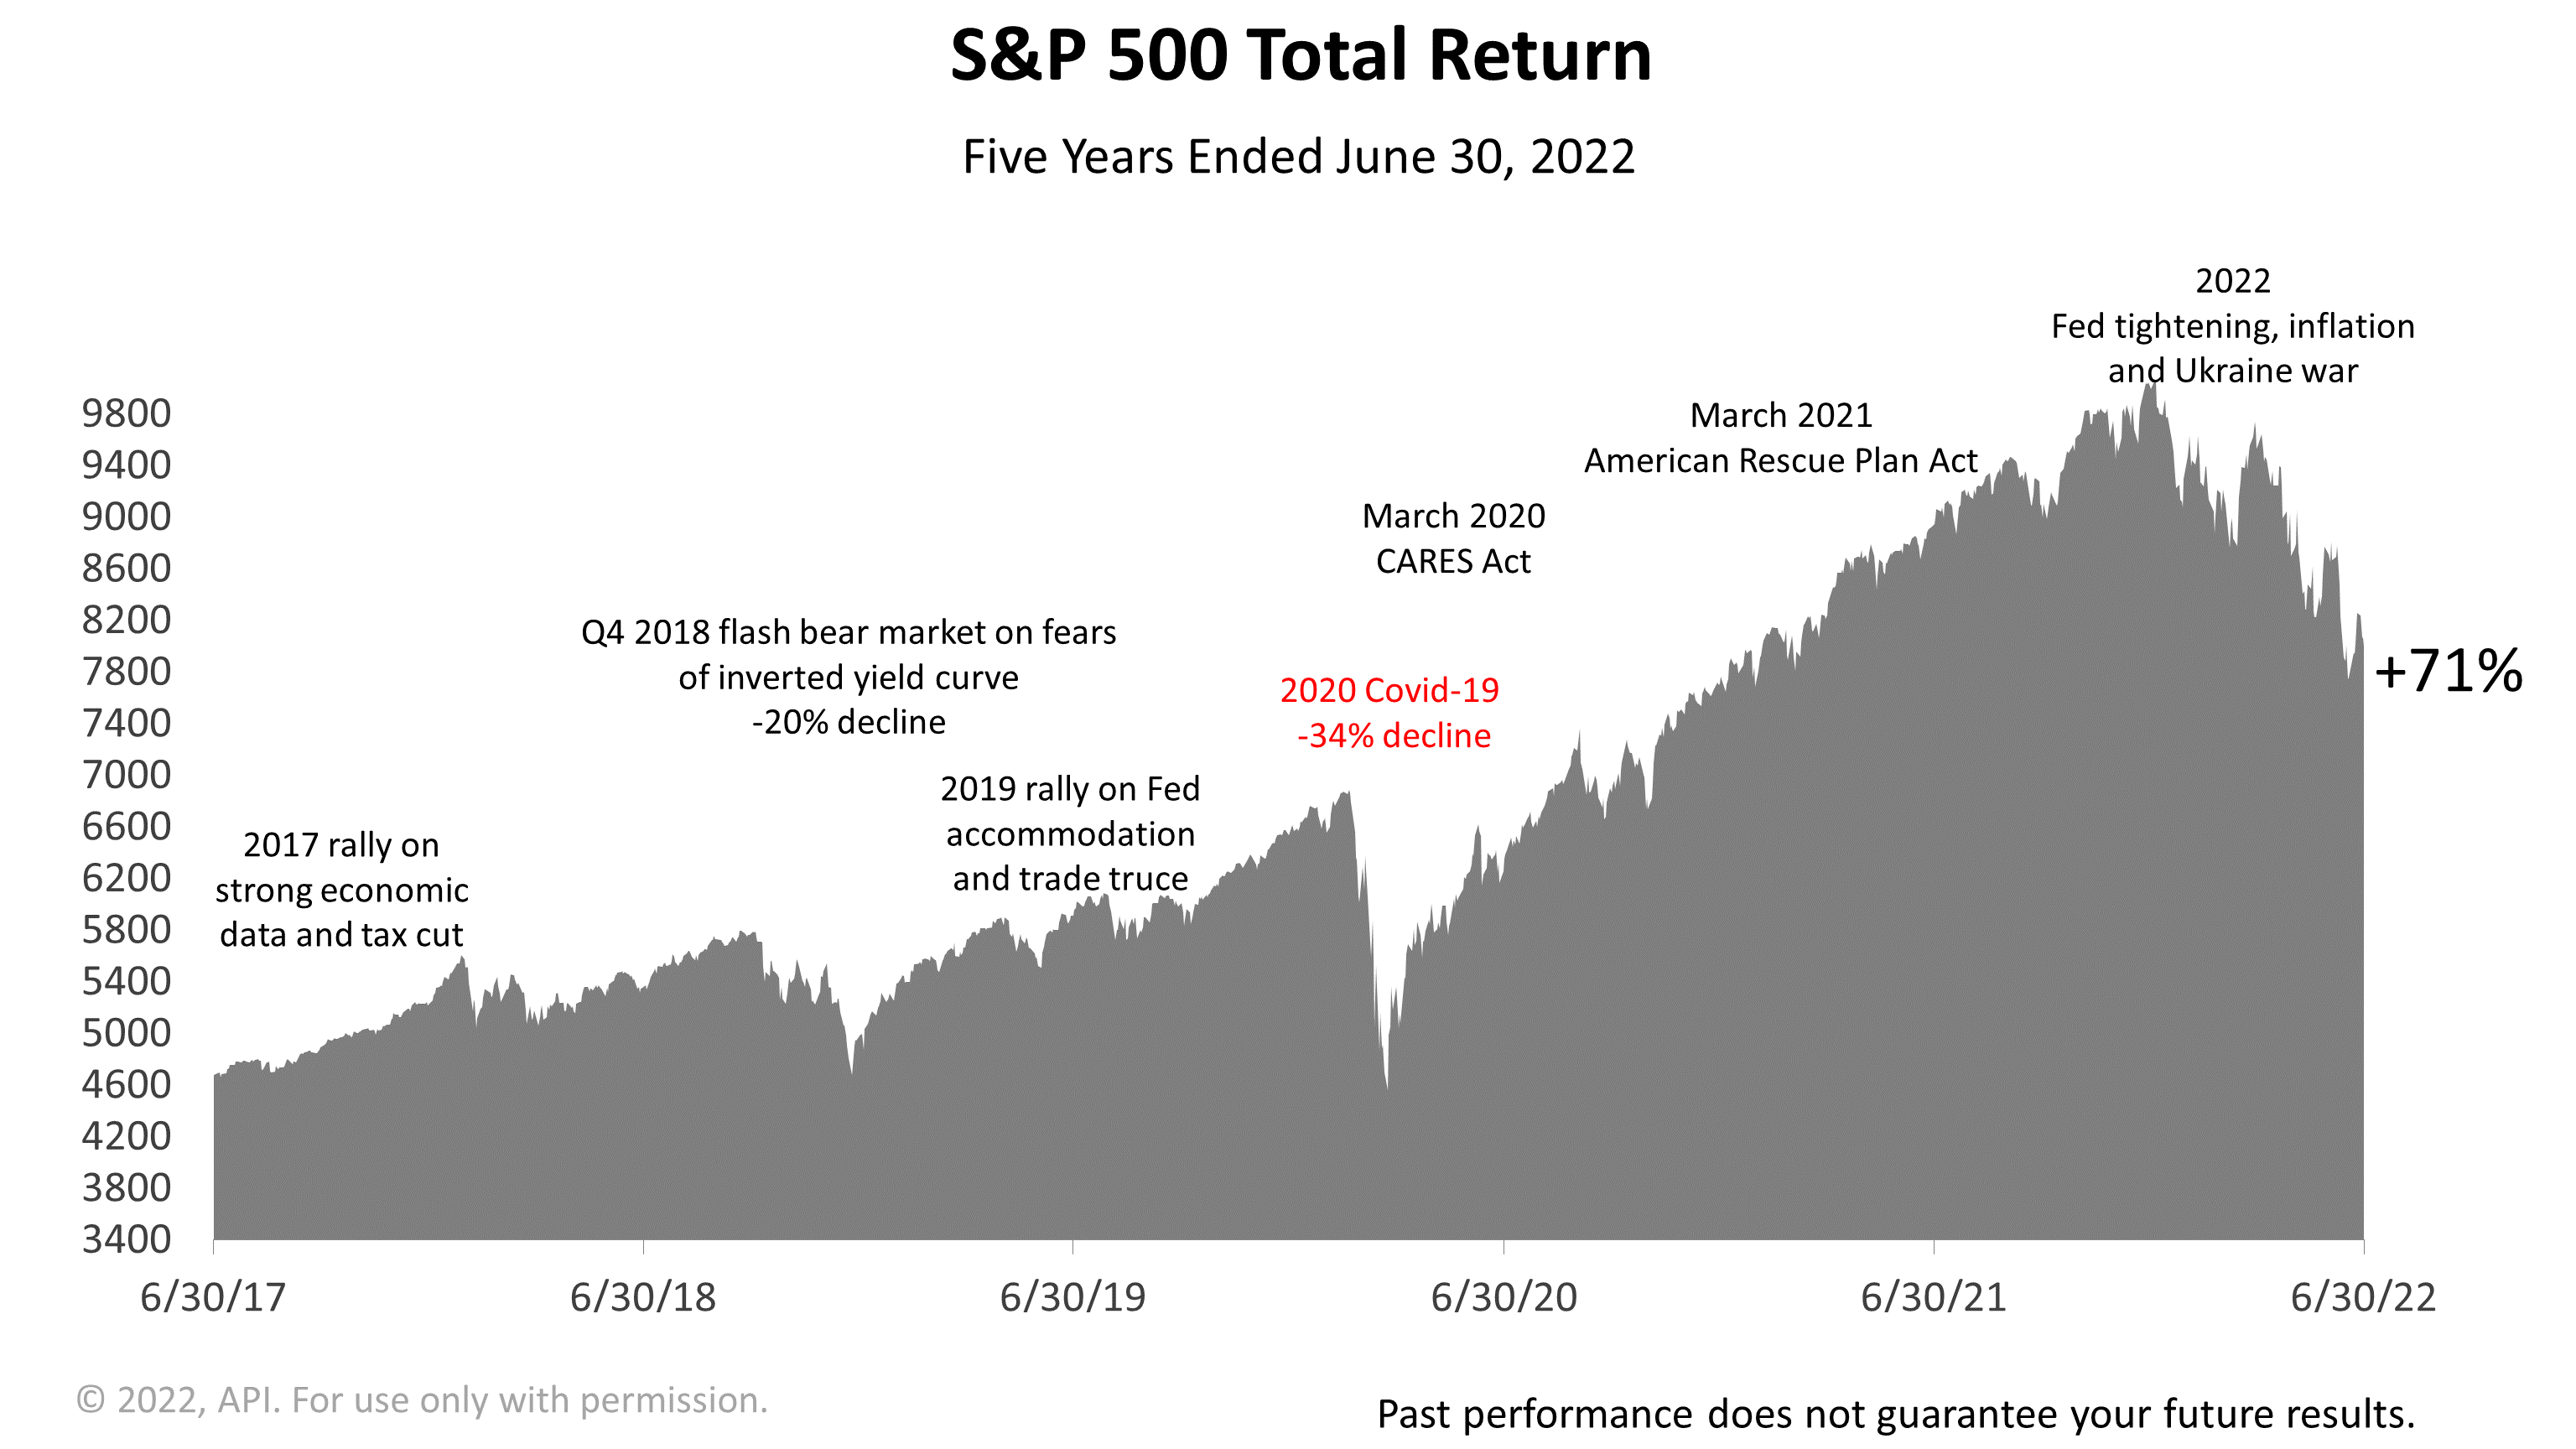
After trading sideways in 2015 and most of 2016, the stock market broke out after the November 2016 election.
The average price of a share in the Standard & Poor’s 500 stock index rose steadily to a new peak on September 20, 2018.
At the end of 2018, stocks nosedived -20% after the Federal Reserve hiked rates.
The Fed hike raised fears that an inverted yield curve was imminent.
It was a classic Fed policy mistake, and that was acknowledged by the Fed chief, as we have documented in previous quarterly updates.
(If you would like more information about that, please email us. )
On January 4, 2019, the Fed signaled rates were on hold, and stocks rallied for most of the remainder of 2019.
Stocks next peaked in February 2020, when the COVID-19 virus threw the economy and stock market into a meltdown.
Government action to add liquidity to the economy through direct aid payments to consumers brought about a swift turnaround that began in late March.
By early September 2020, following the enactment of the CARES Act and related legislation, stocks hit a record all-time high.
After a pause, stocks rallied steadily from the November 2020 election through year-end.
The S&P 500 continued upward through the first quarter of 2021.
The March 2021 enactment of the $1.9 trillion American Rescue Plan Act extended the rally through the end of 2021, despite the Omicron COVID variant.
Stocks turned down in the first quarter of 2022, losing -4.6% on rising inflation, Fed tightening, and Russia’s invasion of Ukraine.
In the second quarter of 2022, with inflation at its highest level since The Great Inflation four decades ago, oil prices were wielded as an economic weapon by Russia to retaliate against the U.S. and the European Union for imposing economic sanctions to punish Russia for its annexation of crucial ports and land routes through Ukraine.
With the Fed expected to hike rates on July 27, and the economy teetering on the edge of a recession, the S&P 500 lost another -16.1% in the second quarter.
However, over the five years ended March 31, 2022, the S&P 500 Total Return index, including dividends, gained +71%.
Click image to enlarge

Click image to enlarge
Click image to enlarge

Click image to enlarge

Click image to enlarge
As data on U.S. economic growth for the second quarter trickled in during June and early July, signs that a recession is already under way began to emerge.
The economy is on the cusp of a recession, and that is clear.
The economy shrunk by -1.5% in the first quarter of 2022, and the second quarter could be negative and, thus, begin a recession officially.
However, some very key fundamentals provide strong evidence that a recession—if there is one—could be short and shallow.

Click image to enlarge
Household balance sheets are exceptionally strong.
Household net worth is higher and has surged like it's never done before.
This suggests underlying support for continued consumer spending, even if we have a recession.

Click image to enlarge
States are flush with cash.
State and federal tax receipts are larger than expected.
State revenue soared during the pandemic as a result of federal stimulus programs and a stronger-than-expected recovery.
States are able to spend and hire.
Click image to enlarge
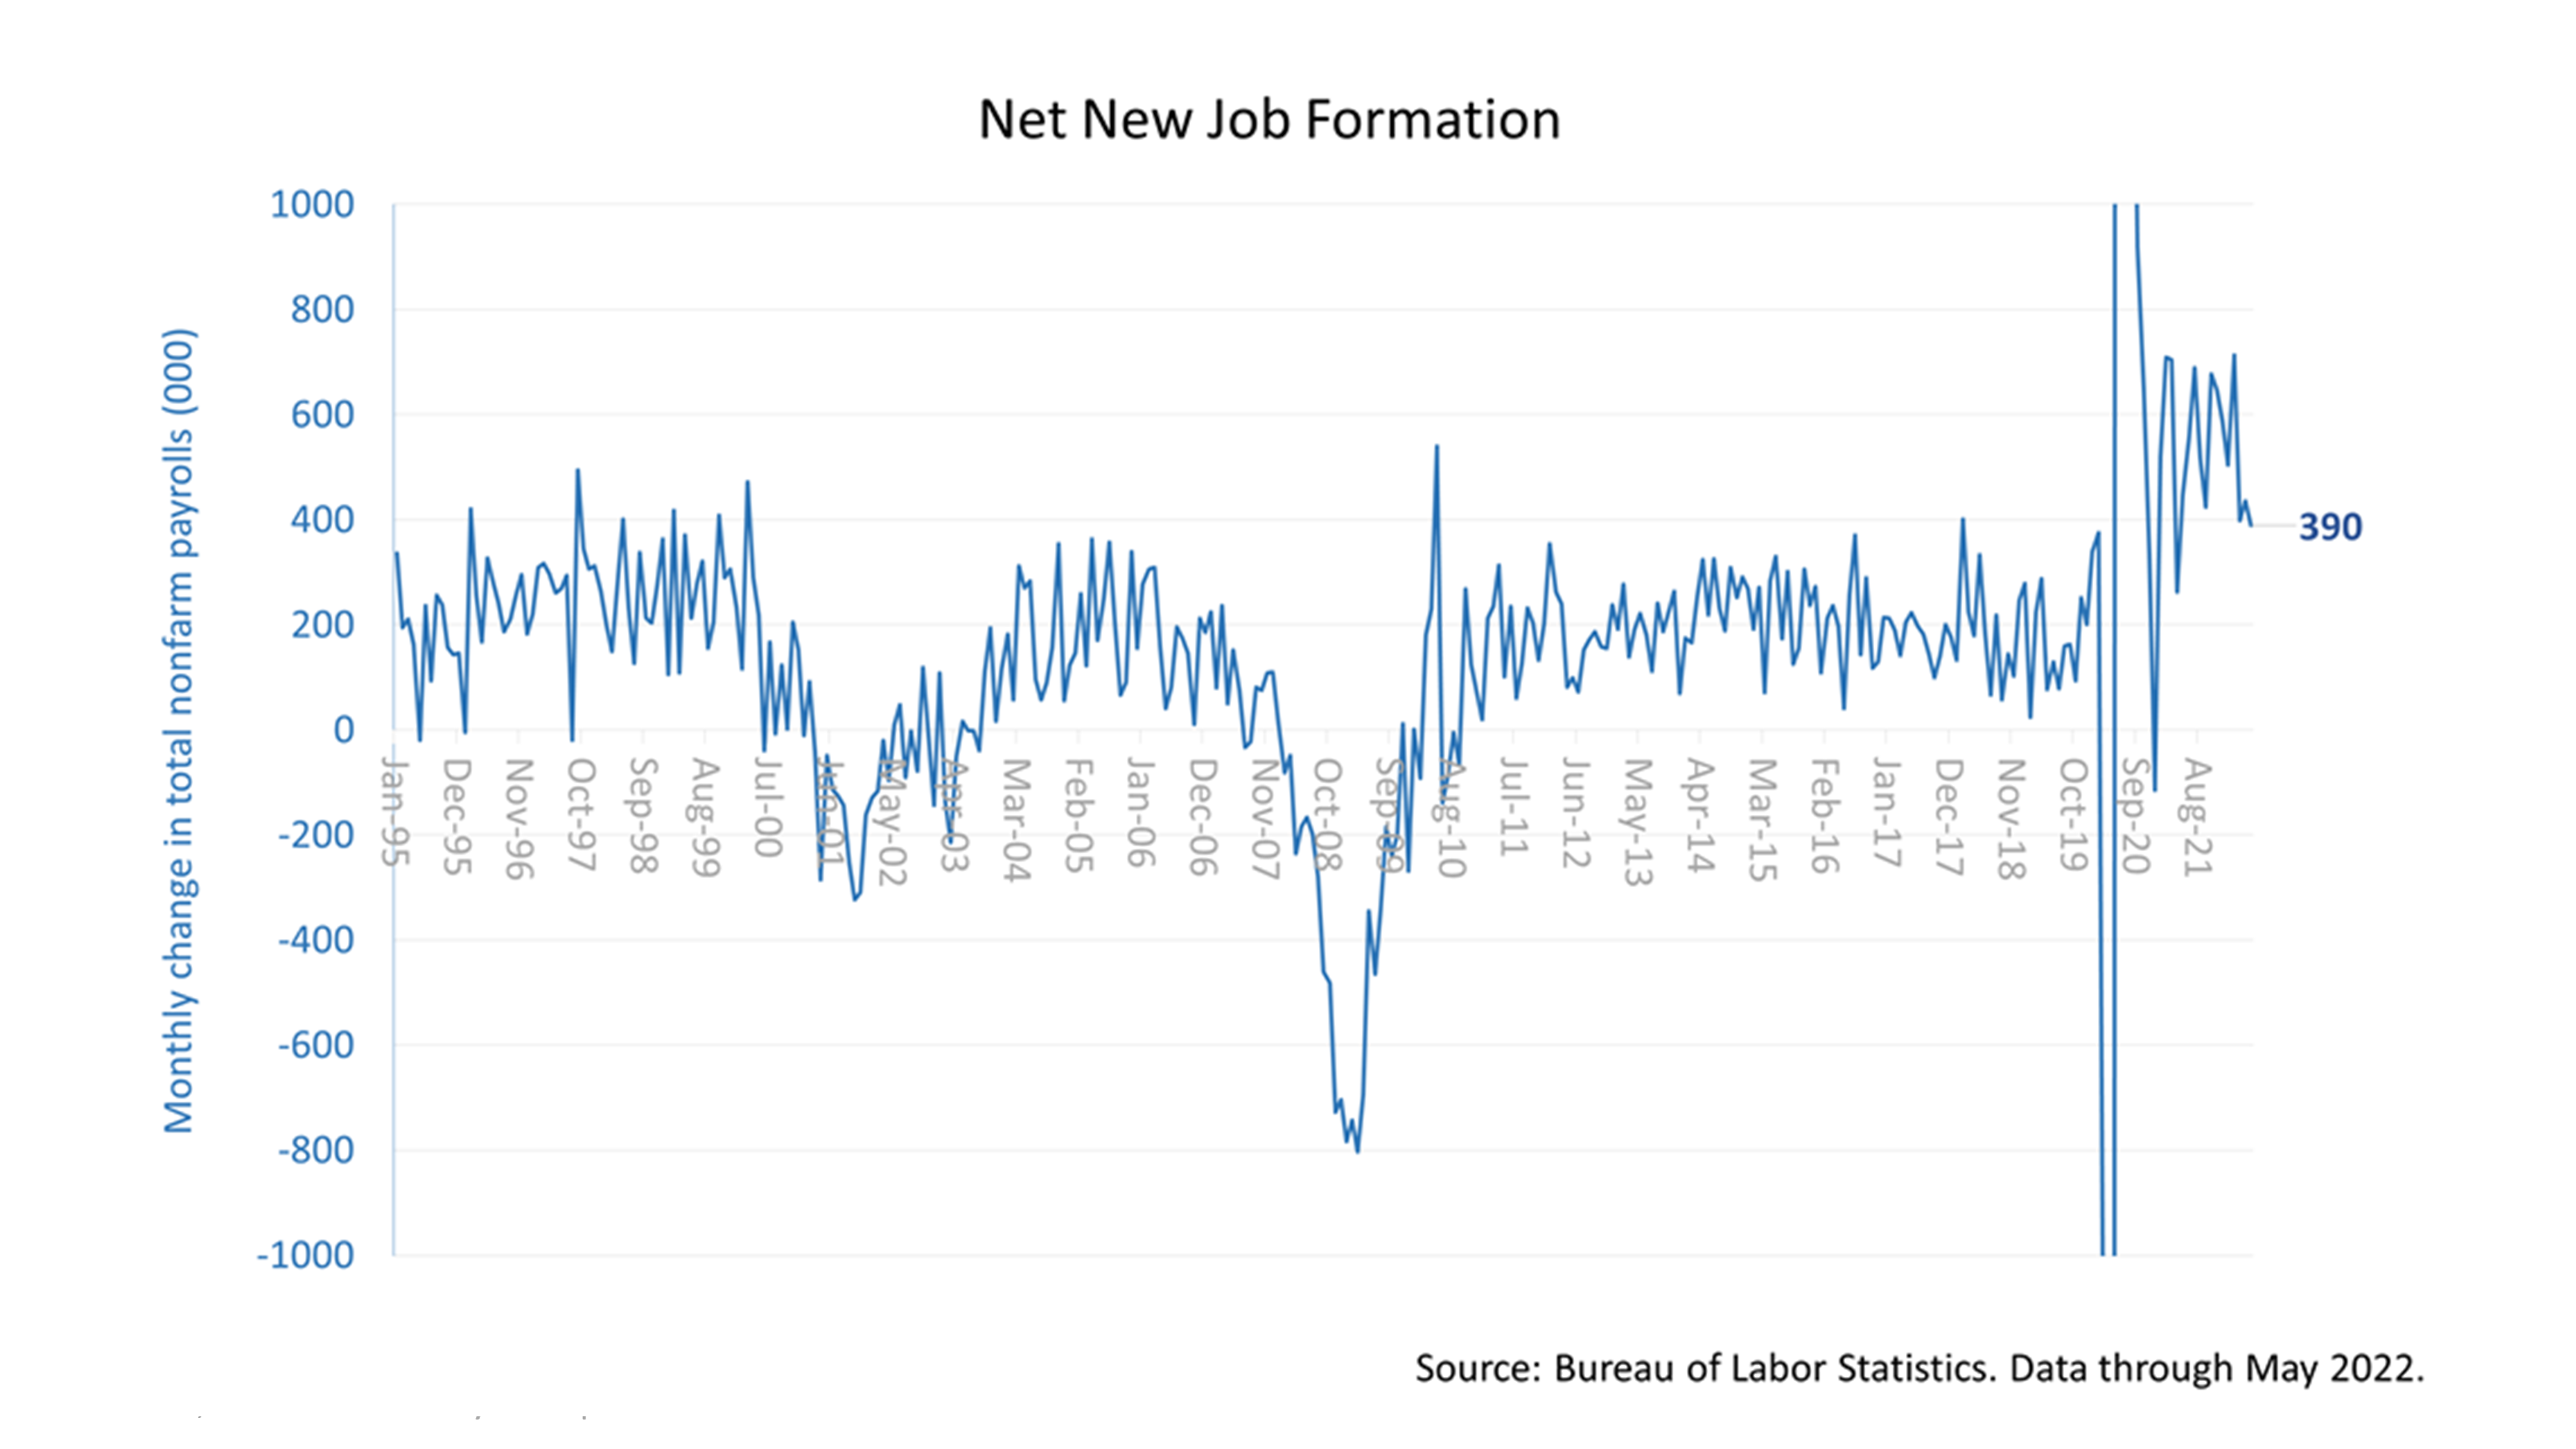
The economy created 390,000 new jobs in May, a very strong number.
Putting more people to work earning more disposable personal income leads to more spending, which leads to GDP growth.
Consumer spending drives GDP growth for the most part, and that starts with new jobs.
Click image to enlarge
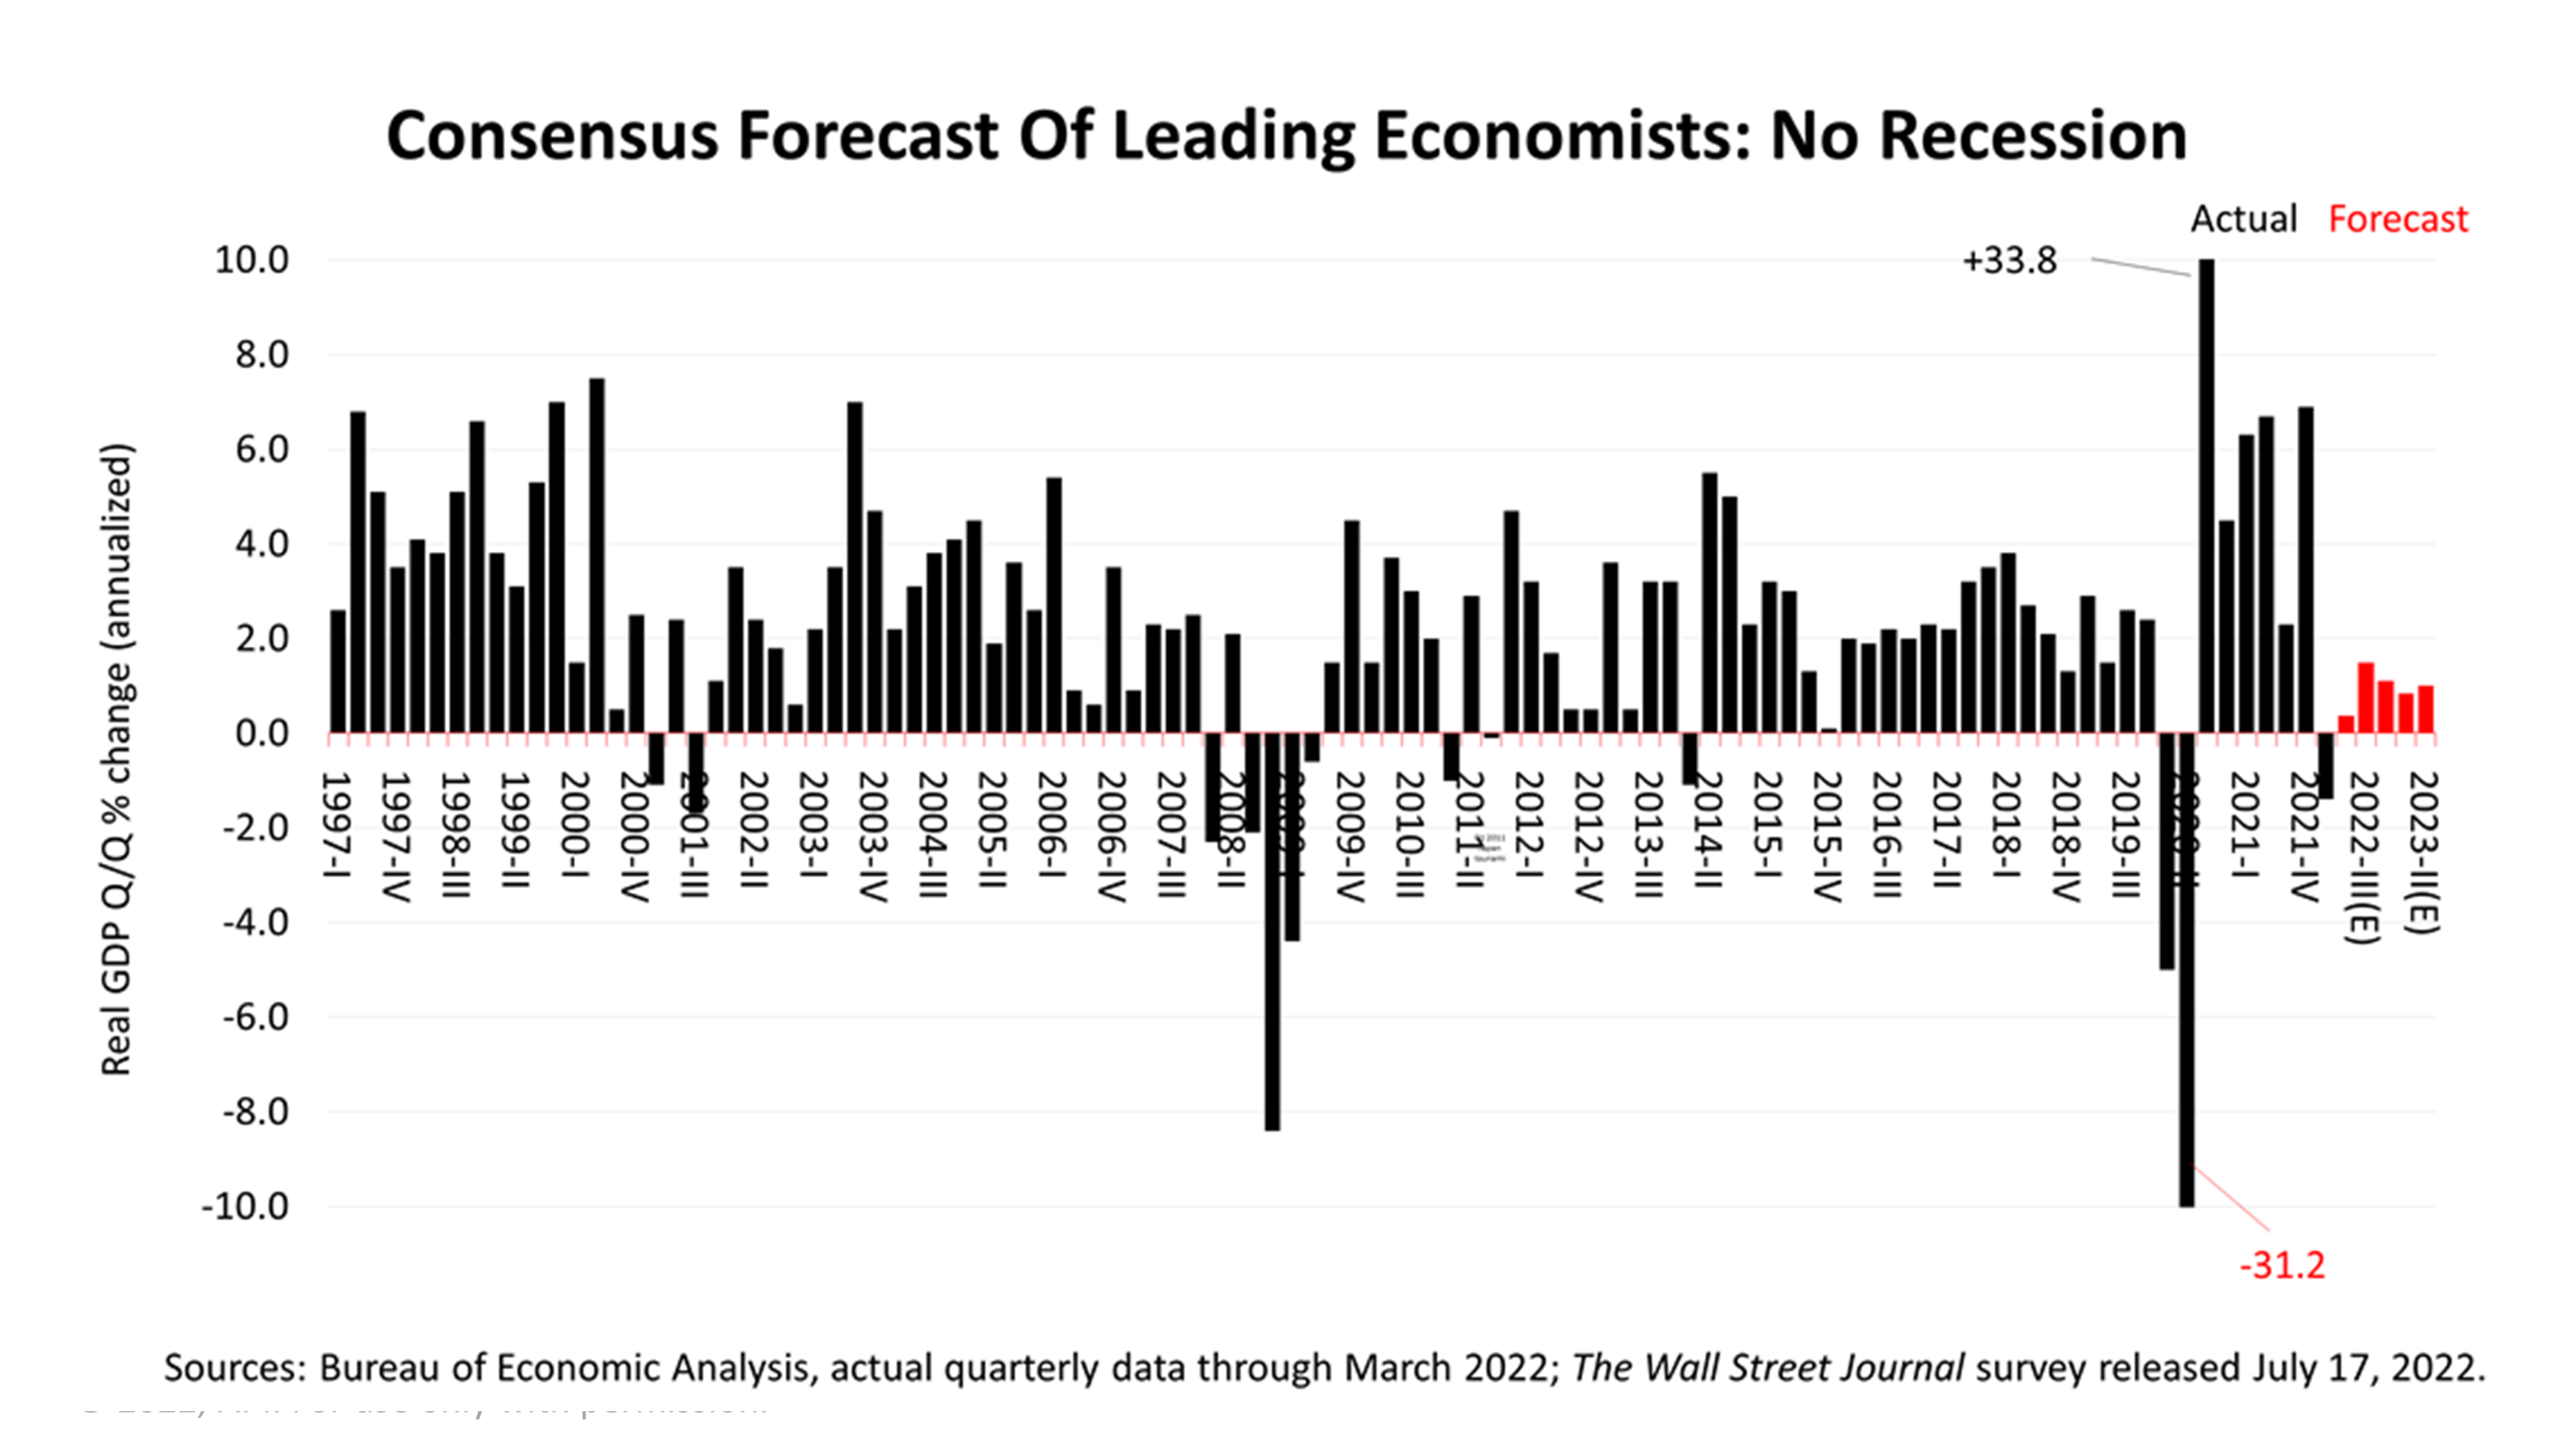
The Wall Street Journal’s quarterly survey of 60 economists projects that the economy will continue to grow for the five quarters through September 2023.
They do not expect a recession.

Click image to enlarge
Finally, while the S&P 500 dropped from its January 3, 2022, all-time closing high of 4796.56 to a closing low of 3666.77 on June 16, a 23% loss, it may already have bottomed.
On July 21, it was down about -17% from its high on a price-only basis from its January 3rd record closing high, and the bear market may already be over.
No one can predict the next near-term market surge or plunge, but the stock market is a leading economic indicator.
