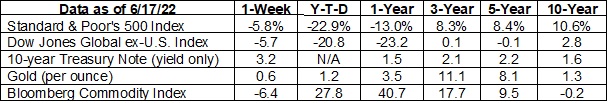
S&P 500, Dow Jones Global ex-US, Gold, Bloomberg Commodity Index returns exclude reinvested dividends (gold does not pay a dividend) and the three-, five-, and 10-year returns are annualized; and the 10-year Treasury Note is simply the yield at the close of the day on each of the historical time periods.
Sources: Yahoo! Finance; MarketWatch; djindexes.com; U.S. Treasury; London Bullion Market Association.
Past performance is no guarantee of future results. Indices are unmanaged and cannot be invested into directly. N/A means not applicable.
IS THE BOND MARKET OR THE STOCK MARKET A BETTER RECESSION PREDICTOR? The stock market has been dropping, but that doesn’t necessarily mean a recession is ahead. The stock market isn’t very accurate when it comes to predicting recessions.
In 1966, following two decades of almost uninterrupted economic growth and stock market gains, a bear market arrived. Stock investors feared a recession might be ahead, and the S&P 500 Index dropped 24 percent over eight months before rebounding and moving higher.
Economist Paul Samuelson, the first person to win a Nobel prize in economics, quipped, “The stock market has predicted nine out of the last five recessions. A factcheck of Samuelson’s off-the-cuff remark in 2016 found that he was right. Bear markets in stocks lead to recessions about 53 percent of the time, reported Steven Liesman of CNBC.
In other words, the stock market has about the same predictive value for recessions as a coin toss. The Treasury bond market has a far better record.
In normal circumstances, yields on Treasuries rise as maturities get longer. So, a two-year Treasury bill will normally yield less than a 10-year Treasury note. On occasion, shorter-maturity Treasuries yield more than longer-maturity Treasuries. This is unusual because investors usually want to earn more when they lend money for a longer period of time. When two-year Treasuries yield more than 10-year Treasuries, we have an inverted yield curve. (The name, “yield curve,” describes how the data looks on a chart.)
An inverted yield curve is a more reliable indicator that a recession is ahead. Alexandra Skaggs of Barron’s explained, “In a recent study of yield curve inversions, BCA Research found that the gap between 2- and 10-year yields has inverted before seven of the past eight recessions...The gap between 3-month and 10-year yields has a better record, calling all 8 recessions without a false signal.”
At the end of last week, the yield curve was not inverted. Three-month and two-year Treasuries were yielding 1.63 percent and 3.17 percent, respectively. The 10-year Treasury was yielding 3.25 percent.
Weekly Focus – Think About It
“My interest is in the future because I am going to spend the rest of my life there."
—Charles Kettering, engineer and inventor